 3
3peptides
spectra
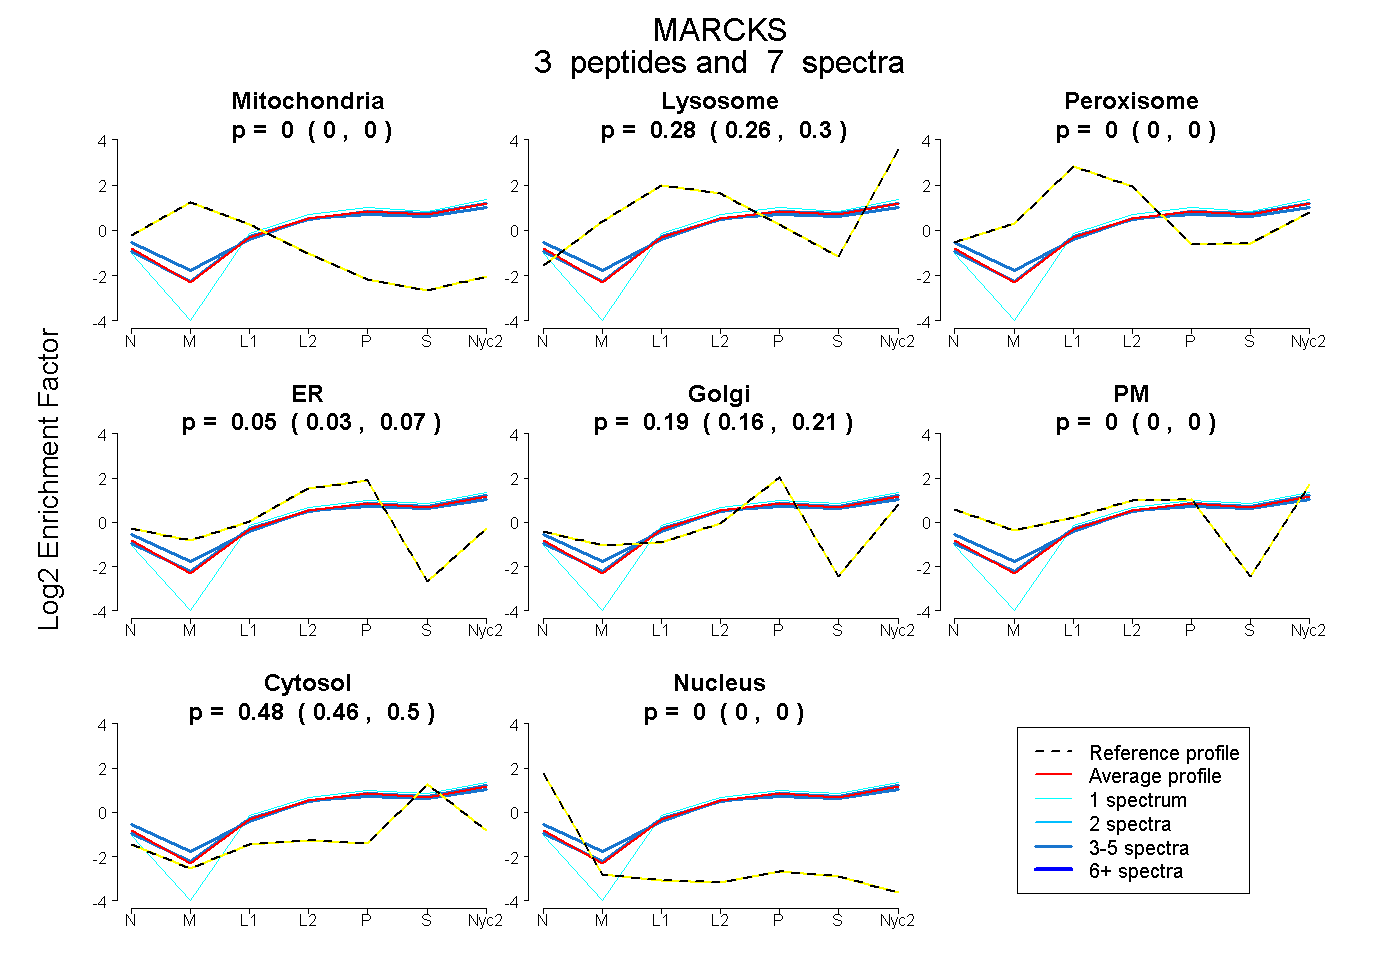
0.000 | 0.000
0.256 | 0.296
0.000 | 0.000
0.025 | 0.073
0.161 | 0.211
0.000 | 0.000
0.462 | 0.497
0.000 | 0.000
2peptides
spectra

0.000 | 0.000
0.000 | 0.030
0.254 | 0.381
0.000 | 0.130
0.000 | 0.000
0.585 | 0.617
0.000 | 0.000
4peptides
spectra
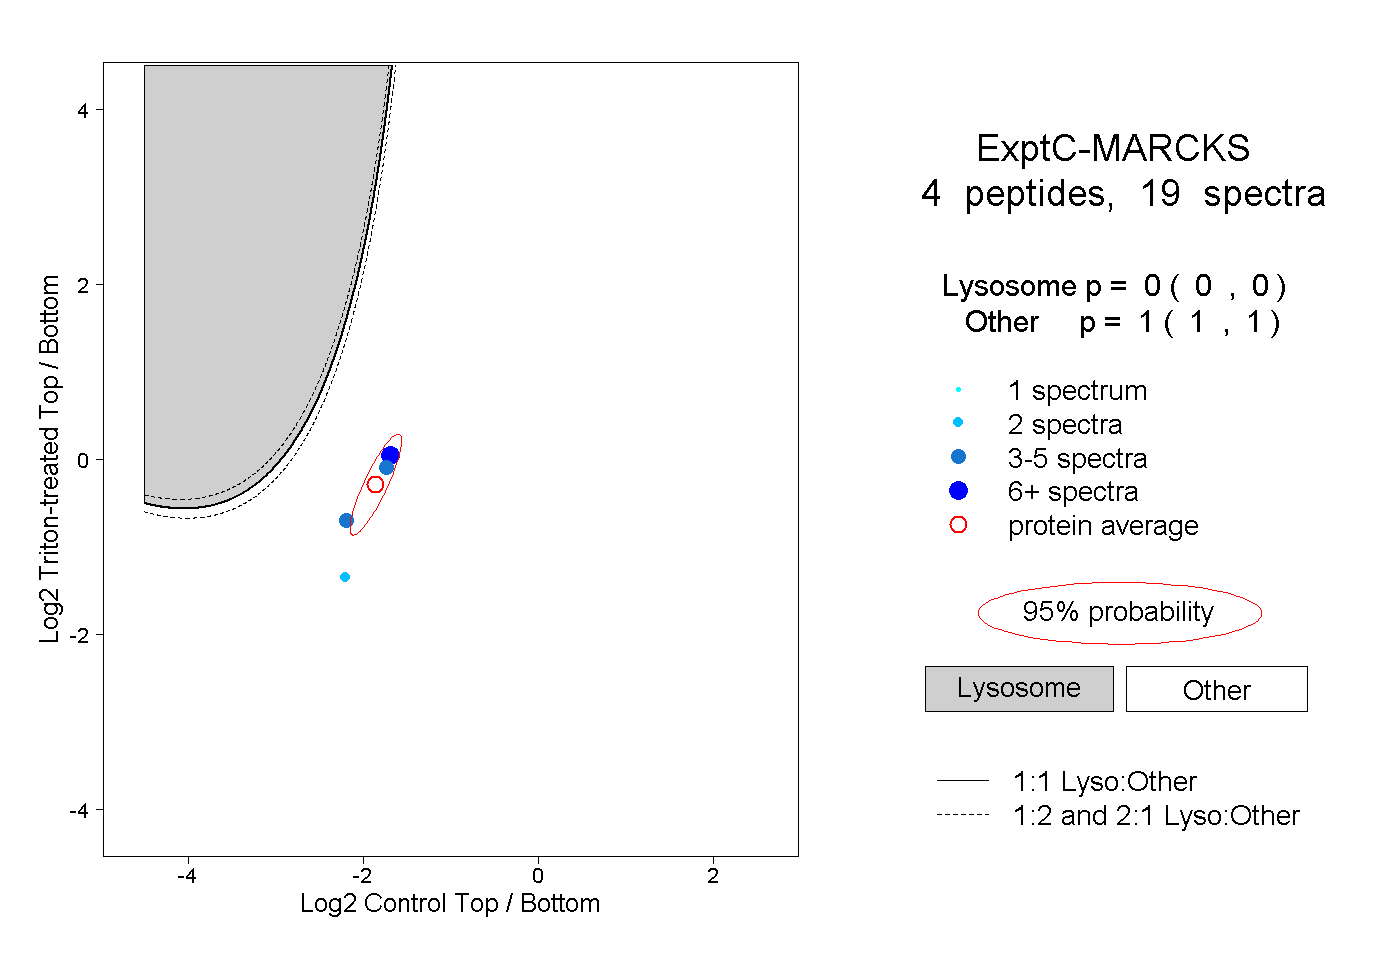
0.000 | 0.000
1.000 | 1.000
3peptides
spectra

0.000 | 0.000
1.000 | 1.000