 3
3peptides
spectra
0.000 | 0.000
0.256 | 0.296
0.000 | 0.000
0.025 | 0.073
0.161 | 0.211
0.000 | 0.000
0.462 | 0.497
0.000 | 0.000
| Plot | Mito | Lyso | Perox | ER | Golgi | PM | Cytosol | Nucleus | |||||
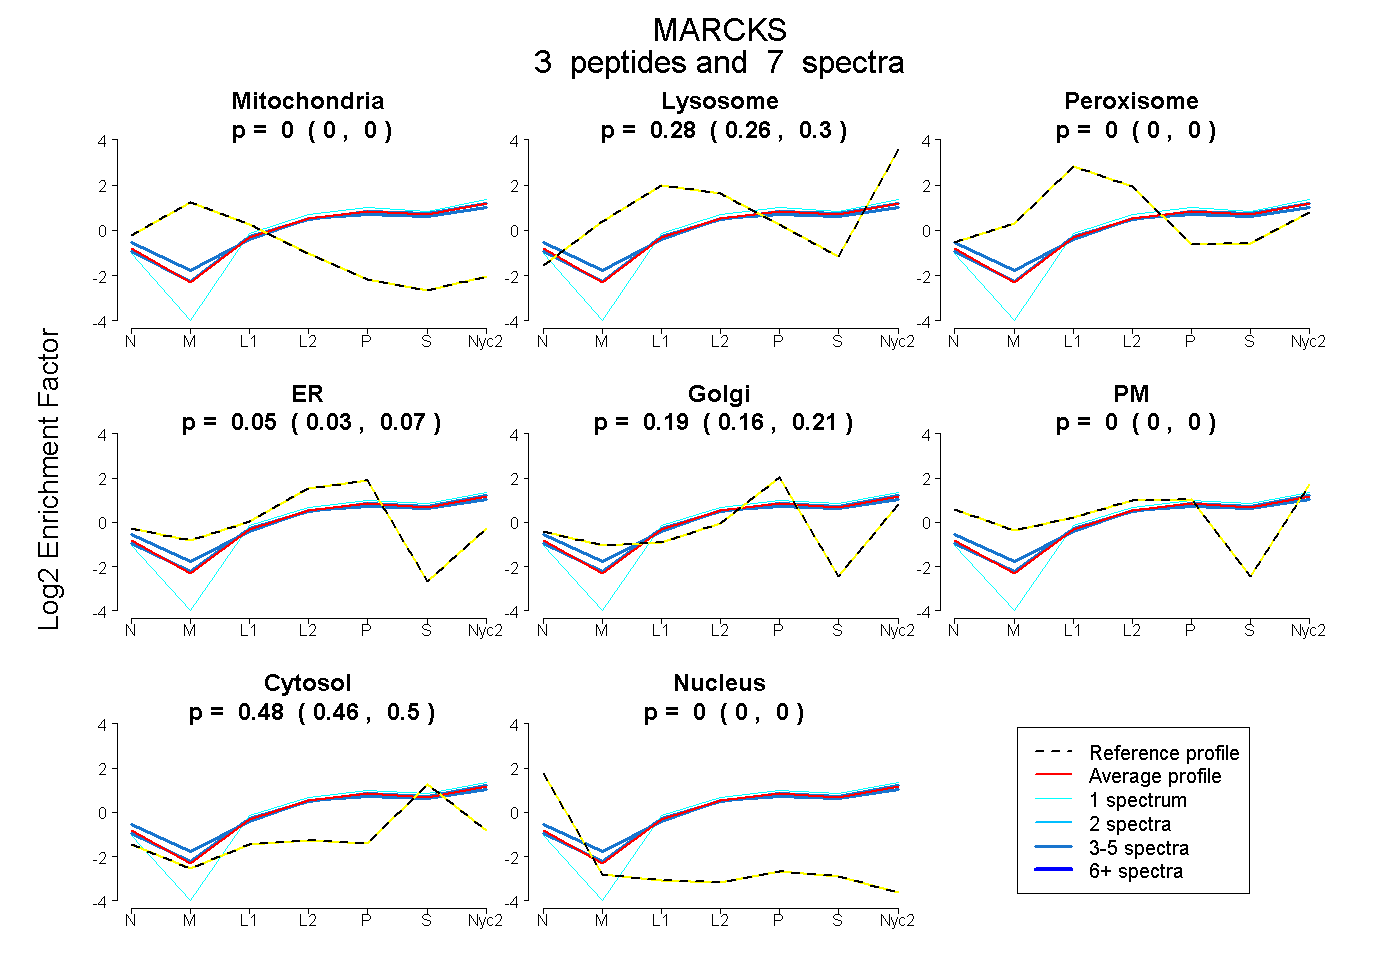
| Expt A |
3 peptides |
7 spectra |
|
0.000 0.000 | 0.000 |
0.280 0.256 | 0.296 |
0.000 0.000 | 0.000 |
0.051 0.025 | 0.073 |
0.188 0.161 | 0.211 |
0.000 0.000 | 0.000 |
0.481 0.462 | 0.497 |
0.000 0.000 | 0.000 |
| 3 spectra, AEEPSEAVGEK | 0.000 | 0.297 | 0.000 | 0.025 | 0.194 | 0.000 | 0.484 | 0.000 | ||
| 3 spectra, LSGFSFK | 0.000 | 0.231 | 0.000 | 0.068 | 0.101 | 0.128 | 0.473 | 0.000 | ||
| 1 spectrum, GEAAAERPGEAAVASSPSK | 0.000 | 0.241 | 0.000 | 0.039 | 0.171 | 0.000 | 0.549 | 0.000 |
| Plot | Mito | Lyso or Perox | ER | Golgi | PM | Cytosol | Nucleus | ||||||
| Expt B |
2 peptides |
3 spectra |
 |
0.000 0.000 | 0.000 |
0.000 0.000 | 0.030 |
0.342 0.254 | 0.381 |
0.051 0.000 | 0.130 |
0.000 0.000 | 0.000 |
0.607 0.585 | 0.617 |
0.000 0.000 | 0.000 |
|||
| Plot | Lyso | Other | |||||||||||
| Expt C |
4 peptides |
19 spectra |
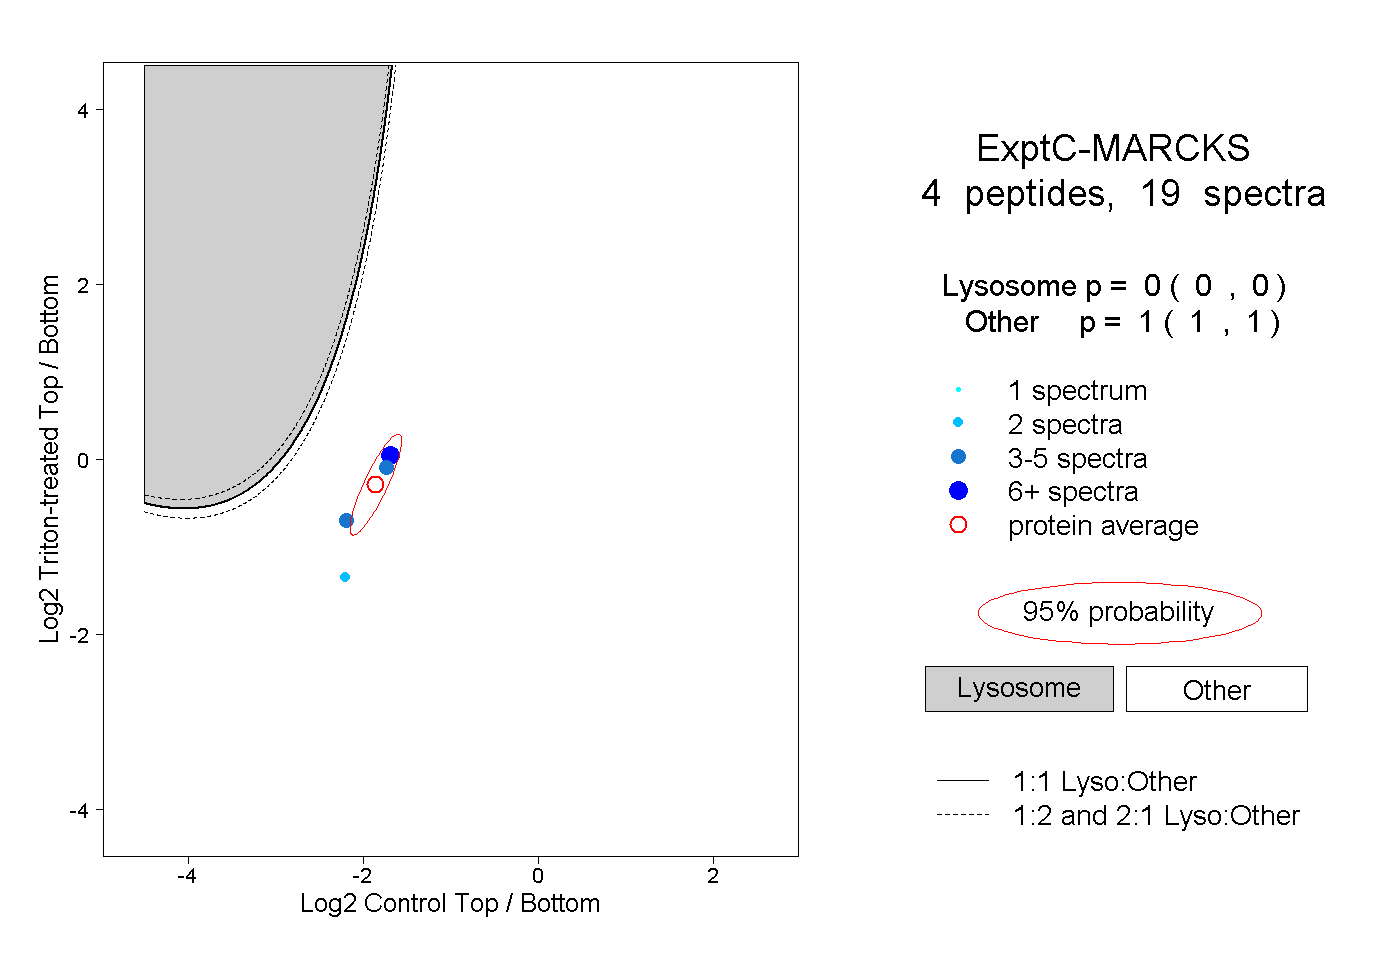 |
0.000 0.000 | 0.000 |
1.000 1.000 | 1.000 |
||||||||
| Plot | Lyso | Other | |||||||||||
| Expt D |
3 peptides |
3 spectra |
 |
0.000 0.000 | 0.000 |
1.000 1.000 | 1.000 |