 2
2peptides
spectra
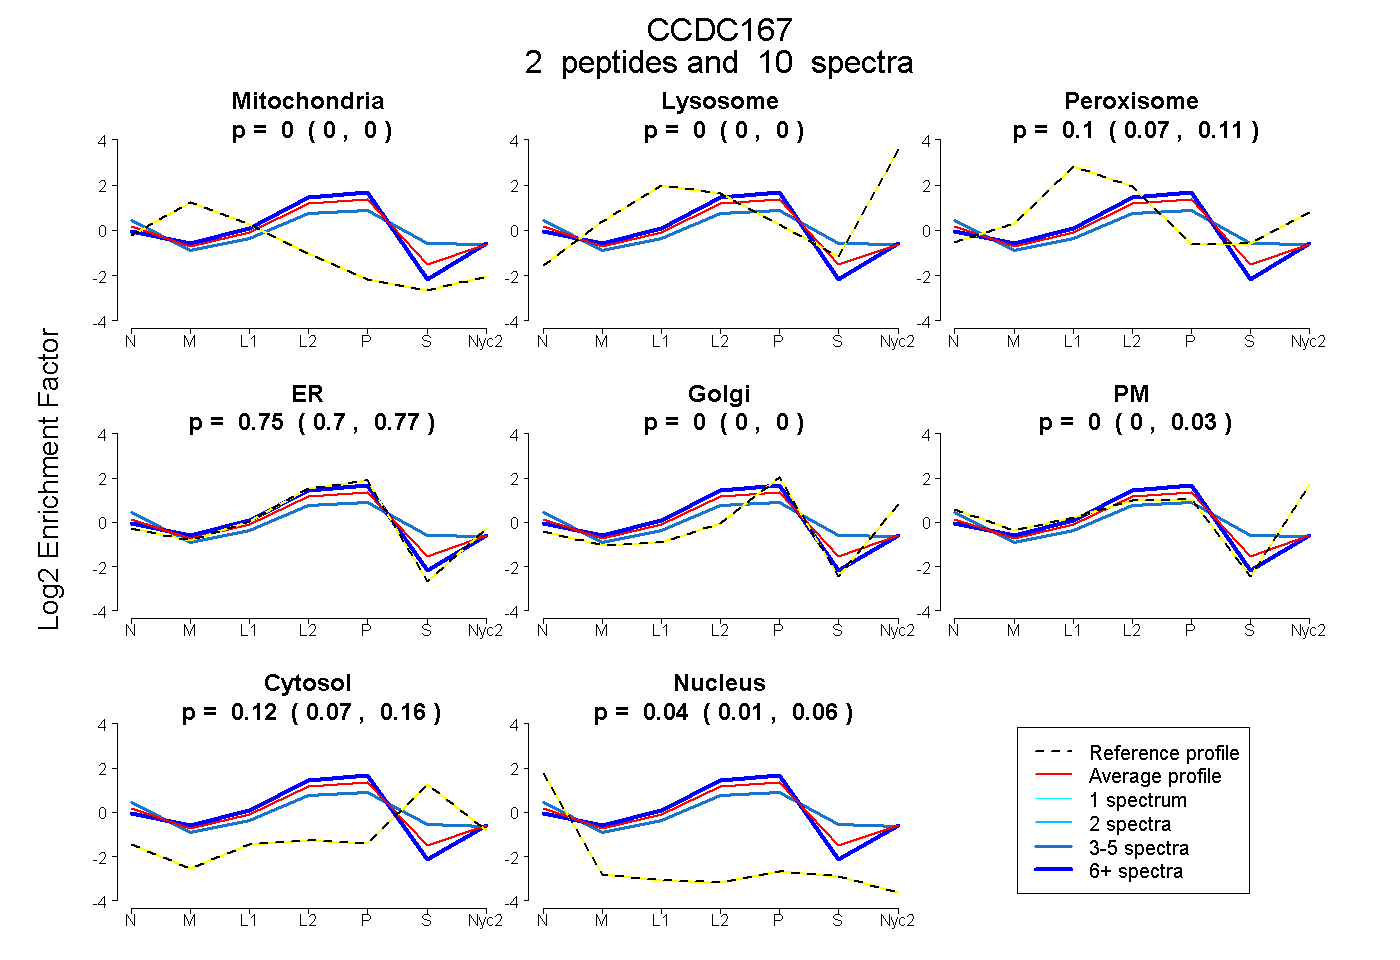
0.000 | 0.000
0.000 | 0.000
0.074 | 0.112
0.705 | 0.773
0.000 | 0.000
0.000 | 0.032
0.074 | 0.160
0.008 | 0.060
3peptides
spectra
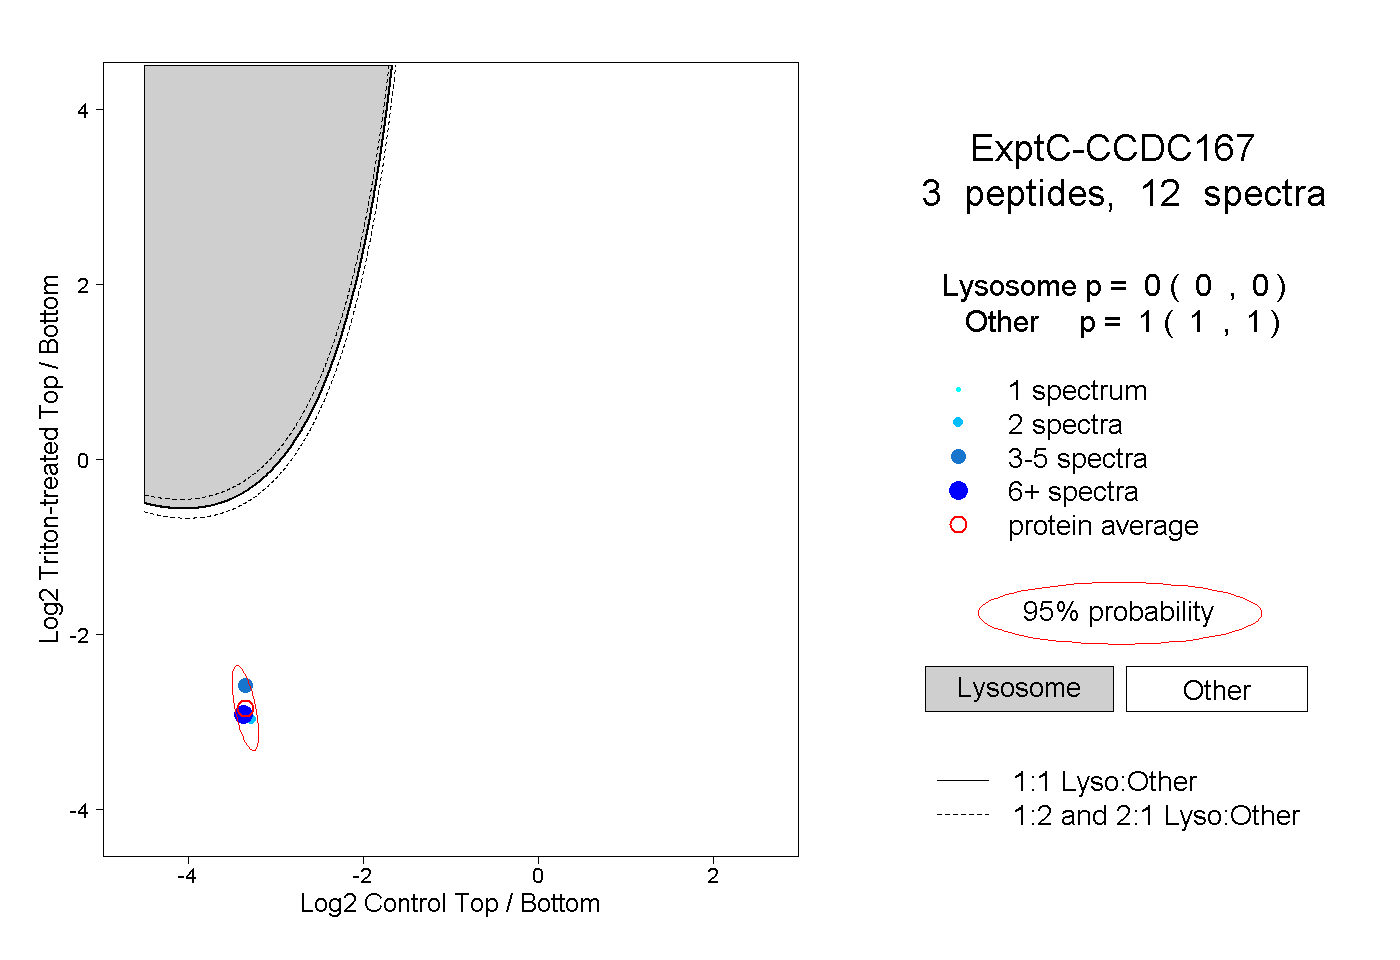
0.000 | 0.000
1.000 | 1.000
1peptide
spectra
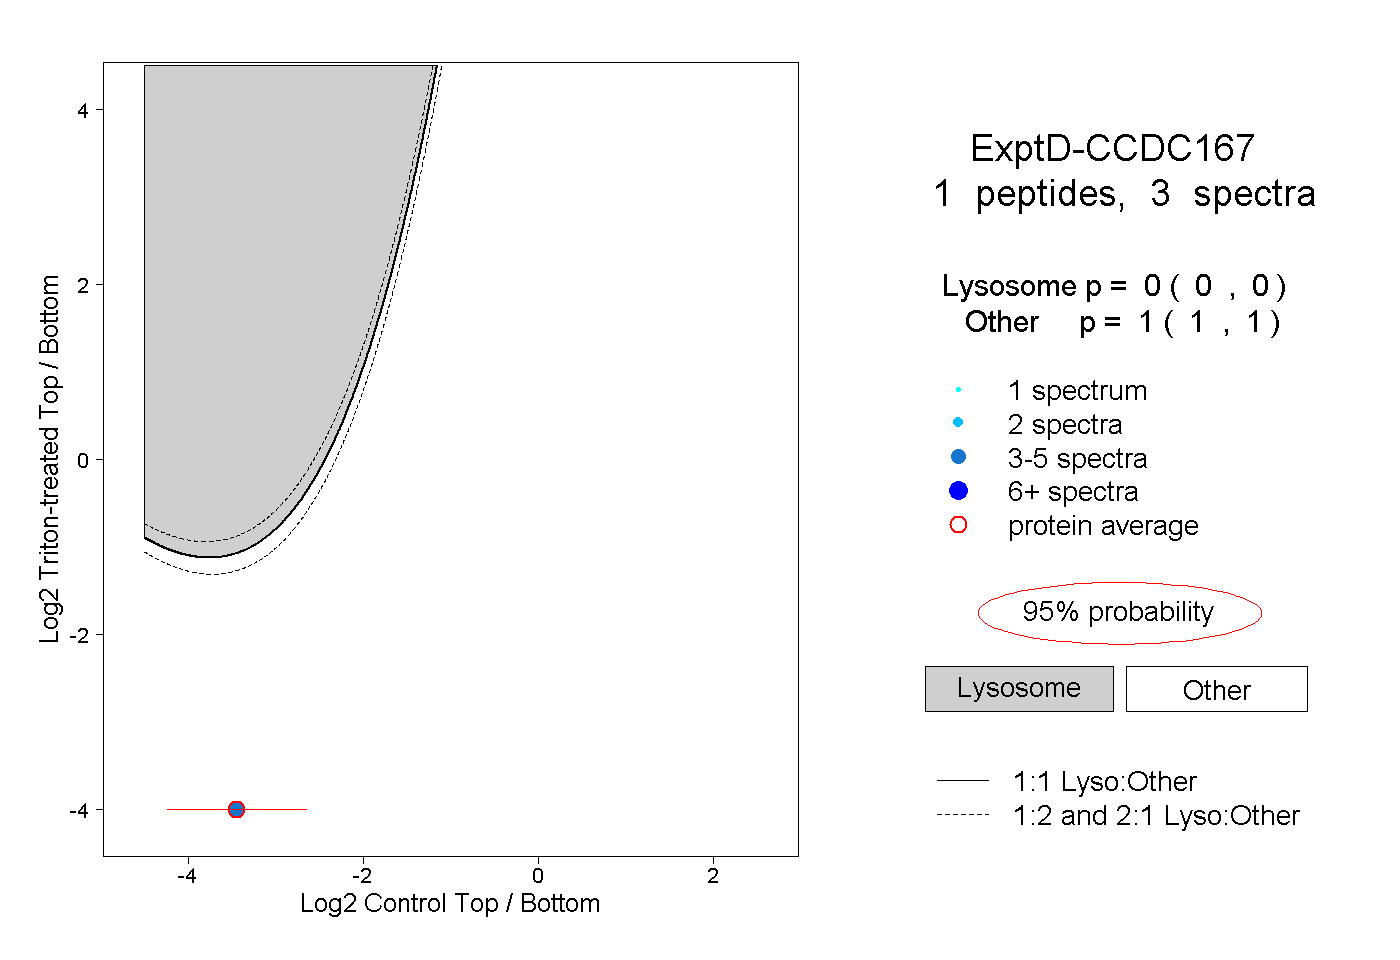
0.000 | 0.000
1.000 | 1.000