 2
2peptides
spectra
0.000 | 0.000
0.000 | 0.000
0.074 | 0.112
0.705 | 0.773
0.000 | 0.000
0.000 | 0.032
0.074 | 0.160
0.008 | 0.060
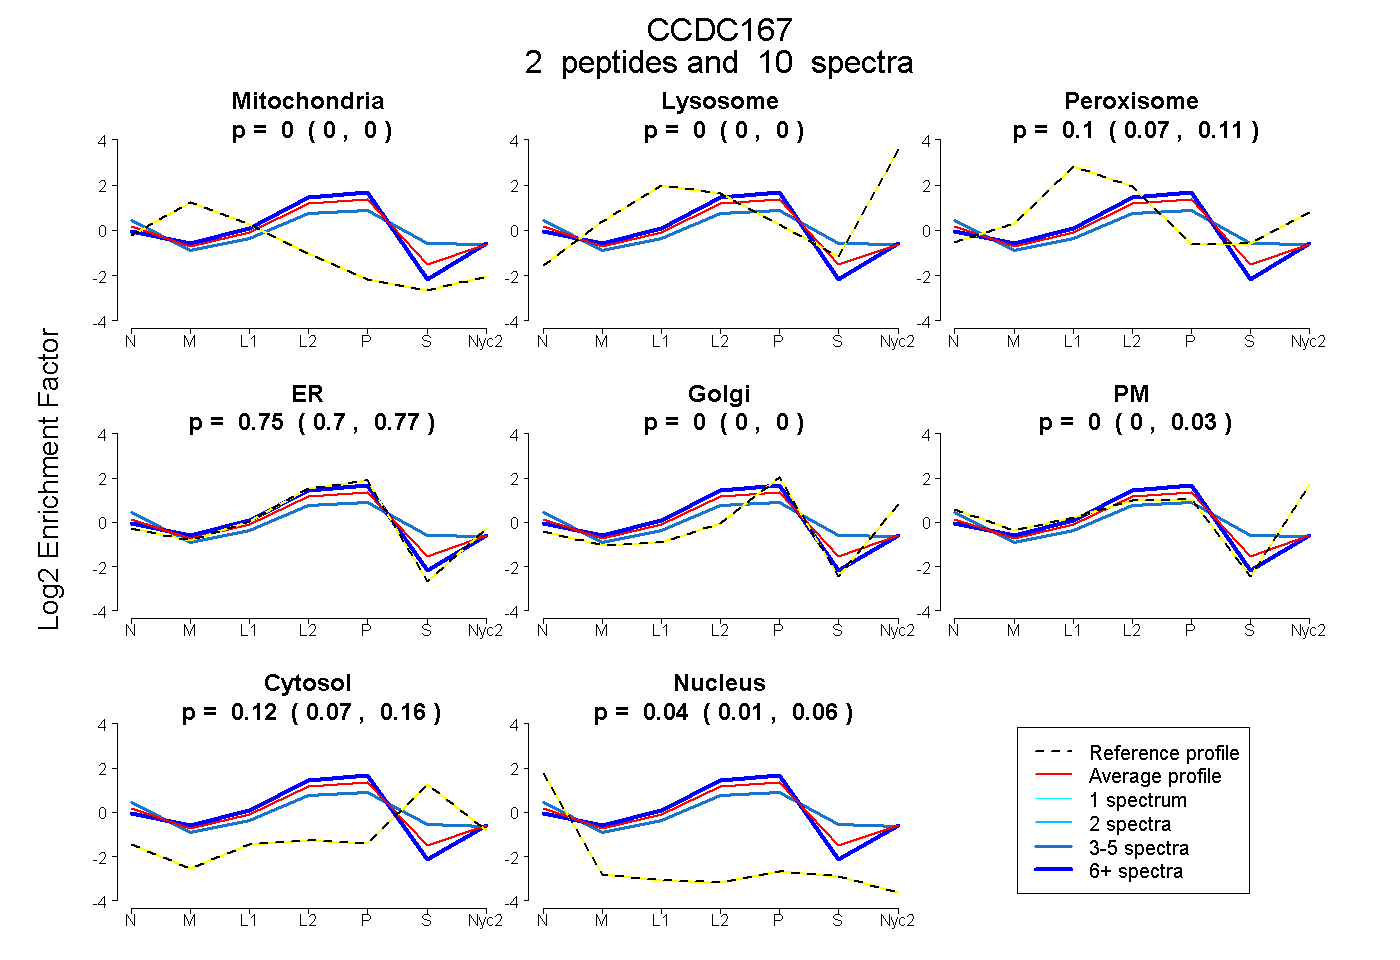
| Plot | Mito | Lyso | Perox | ER | Golgi | PM | Cytosol | Nucleus | |||||
| Expt A |
2 peptides |
10 spectra |
|
0.000 0.000 | 0.000 |
0.000 0.000 | 0.000 |
0.096 0.074 | 0.112 |
0.747 0.705 | 0.773 |
0.000 0.000 | 0.000 |
0.000 0.000 | 0.032 |
0.120 0.074 | 0.160 |
0.037 0.008 | 0.060 |
| 6 spectra, EIDGLEEK | 0.023 | 0.000 | 0.060 | 0.877 | 0.000 | 0.000 | 0.023 | 0.017 | ||
| 4 spectra, DLEAVTSQLHR | 0.000 | 0.000 | 0.103 | 0.505 | 0.000 | 0.074 | 0.279 | 0.039 |
| Plot | Lyso | Other | |||||||||||
| Expt C |
3 peptides |
12 spectra |
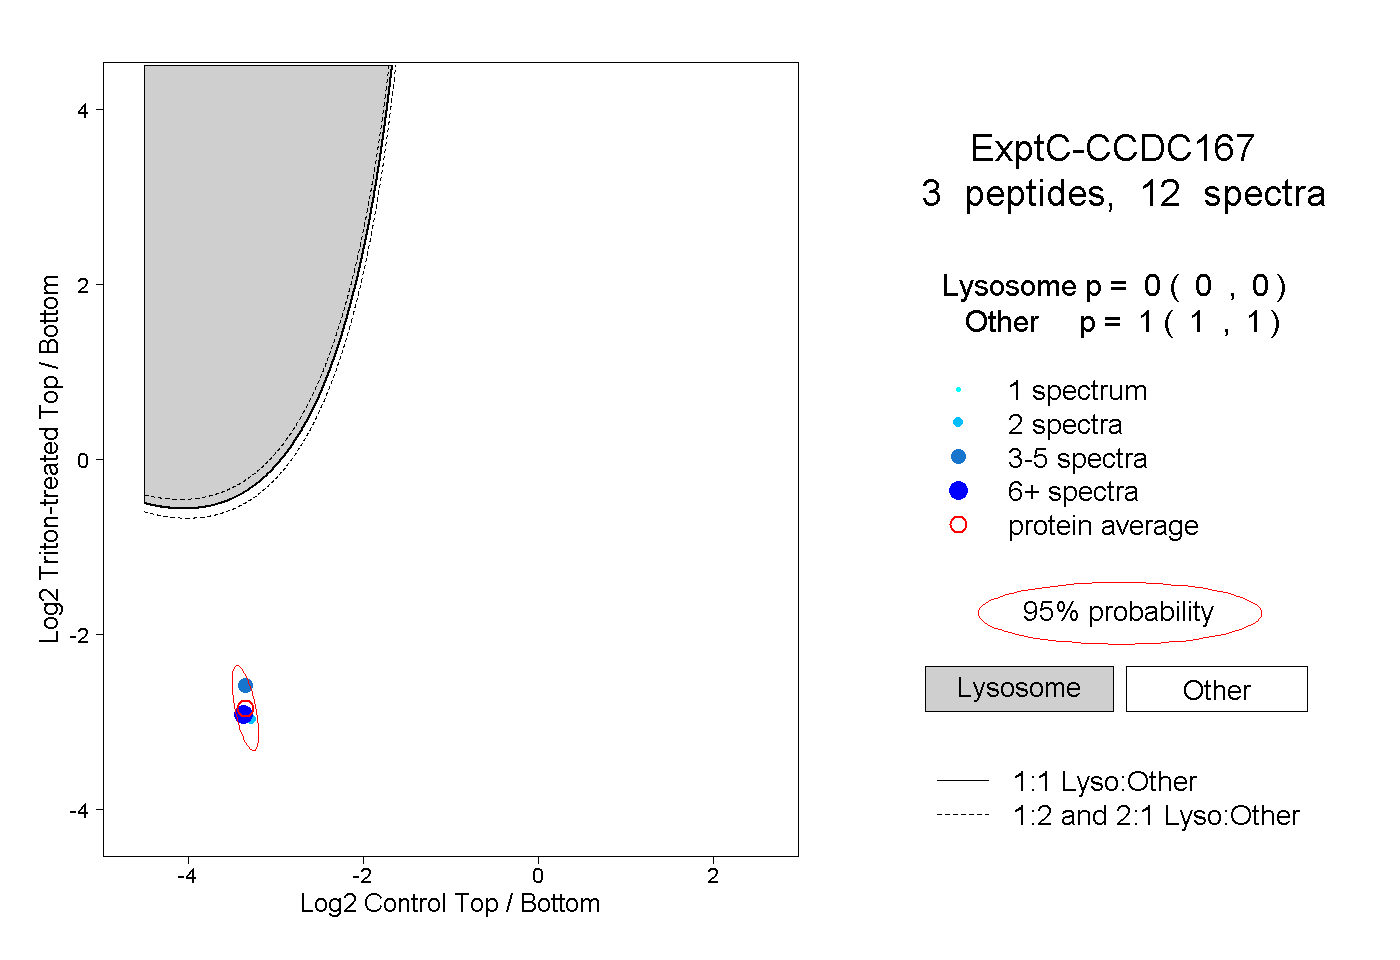 |
0.000 0.000 | 0.000 |
1.000 1.000 | 1.000 |
||||||||
| Plot | Lyso | Other | |||||||||||
| Expt D |
1 peptide |
3 spectra |
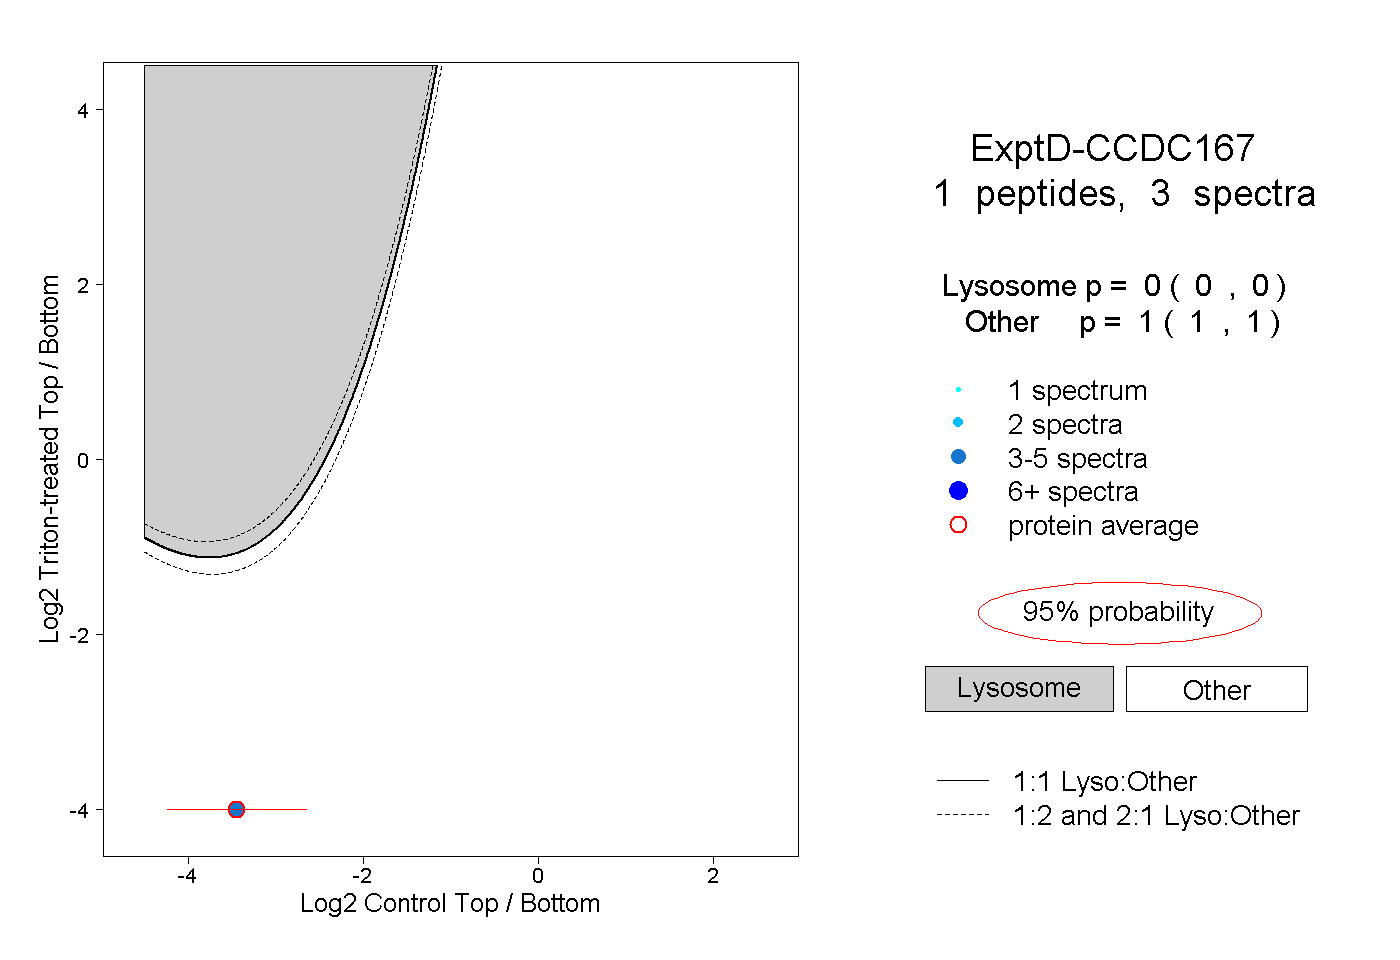 |
0.000 0.000 | 0.000 |
1.000 1.000 | 1.000 |