 8
8peptides
spectra
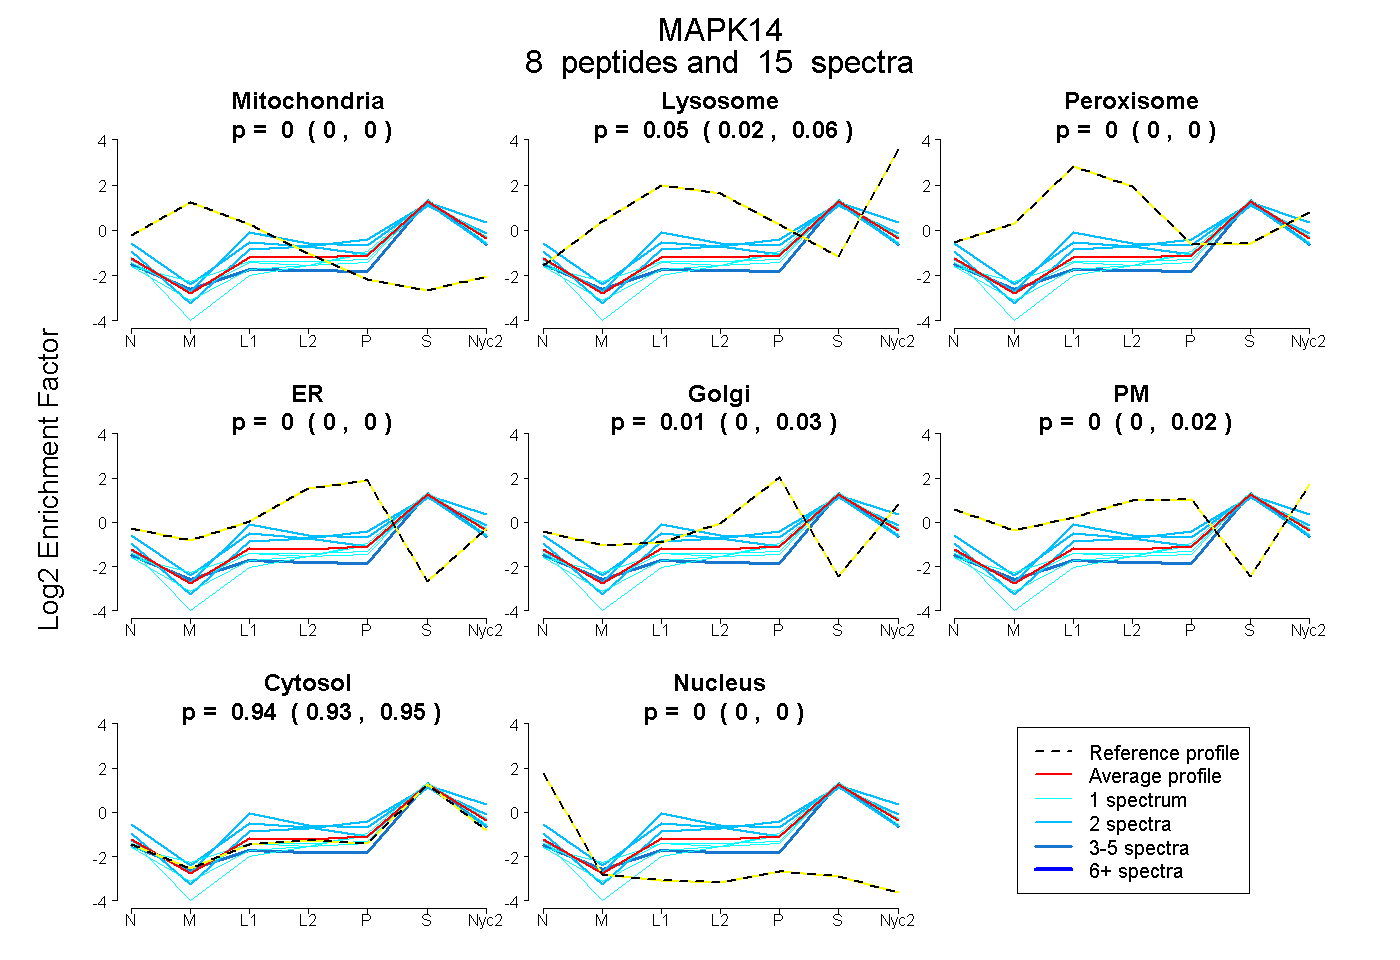
0.000 | 0.000
0.022 | 0.059
0.000 | 0.000
0.000 | 0.000
0.000 | 0.028
0.000 | 0.023
0.929 | 0.952
0.000 | 0.000
2peptides
spectra
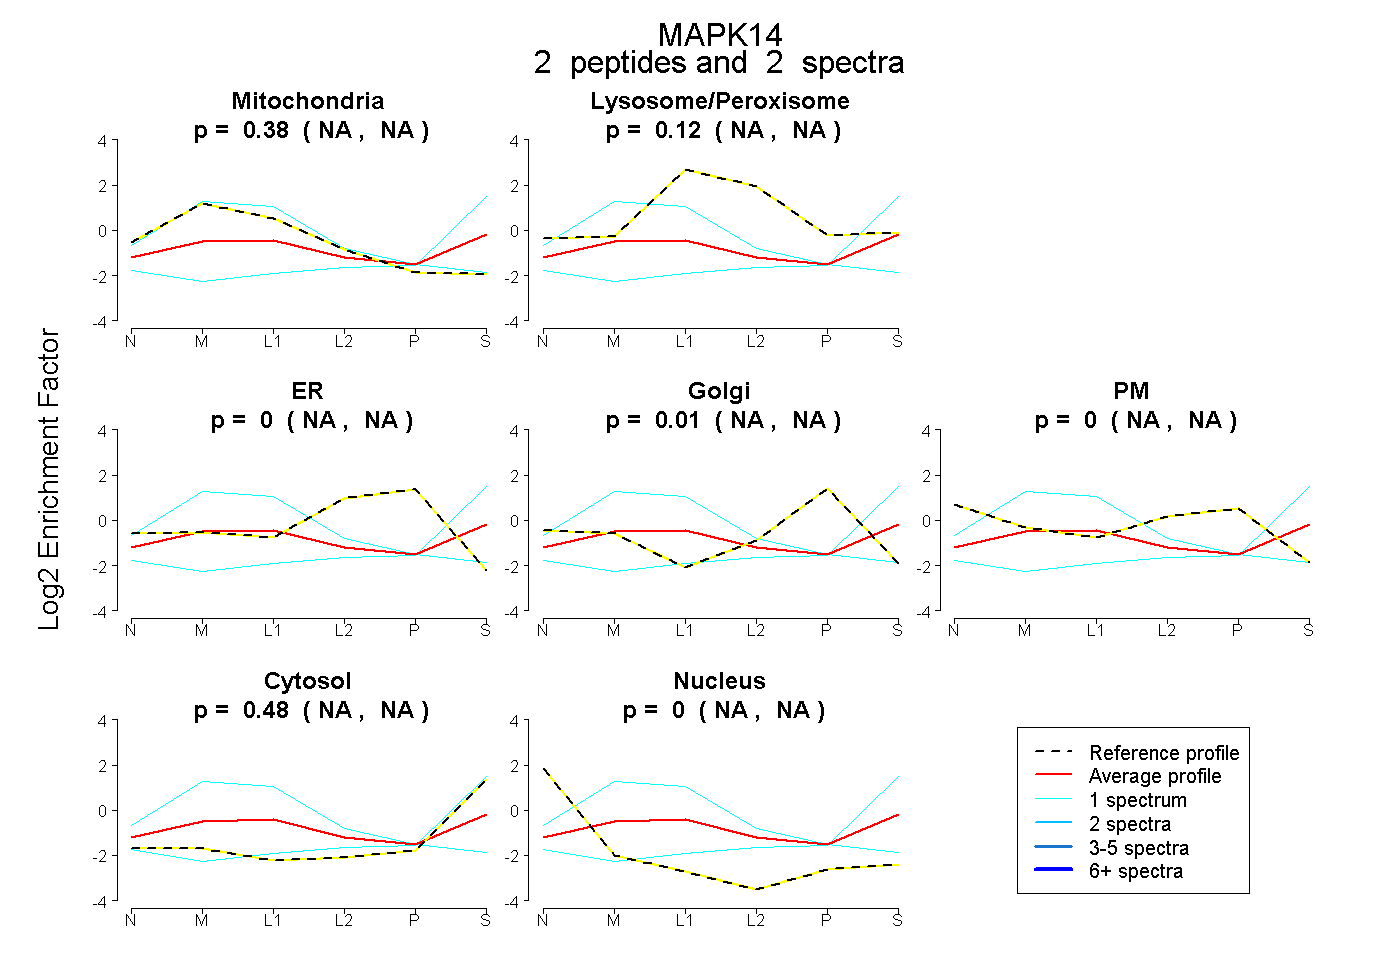
NA | NA
NA | NA
NA | NA
NA | NA
NA | NA
NA | NA
NA | NA
1peptide
spectra
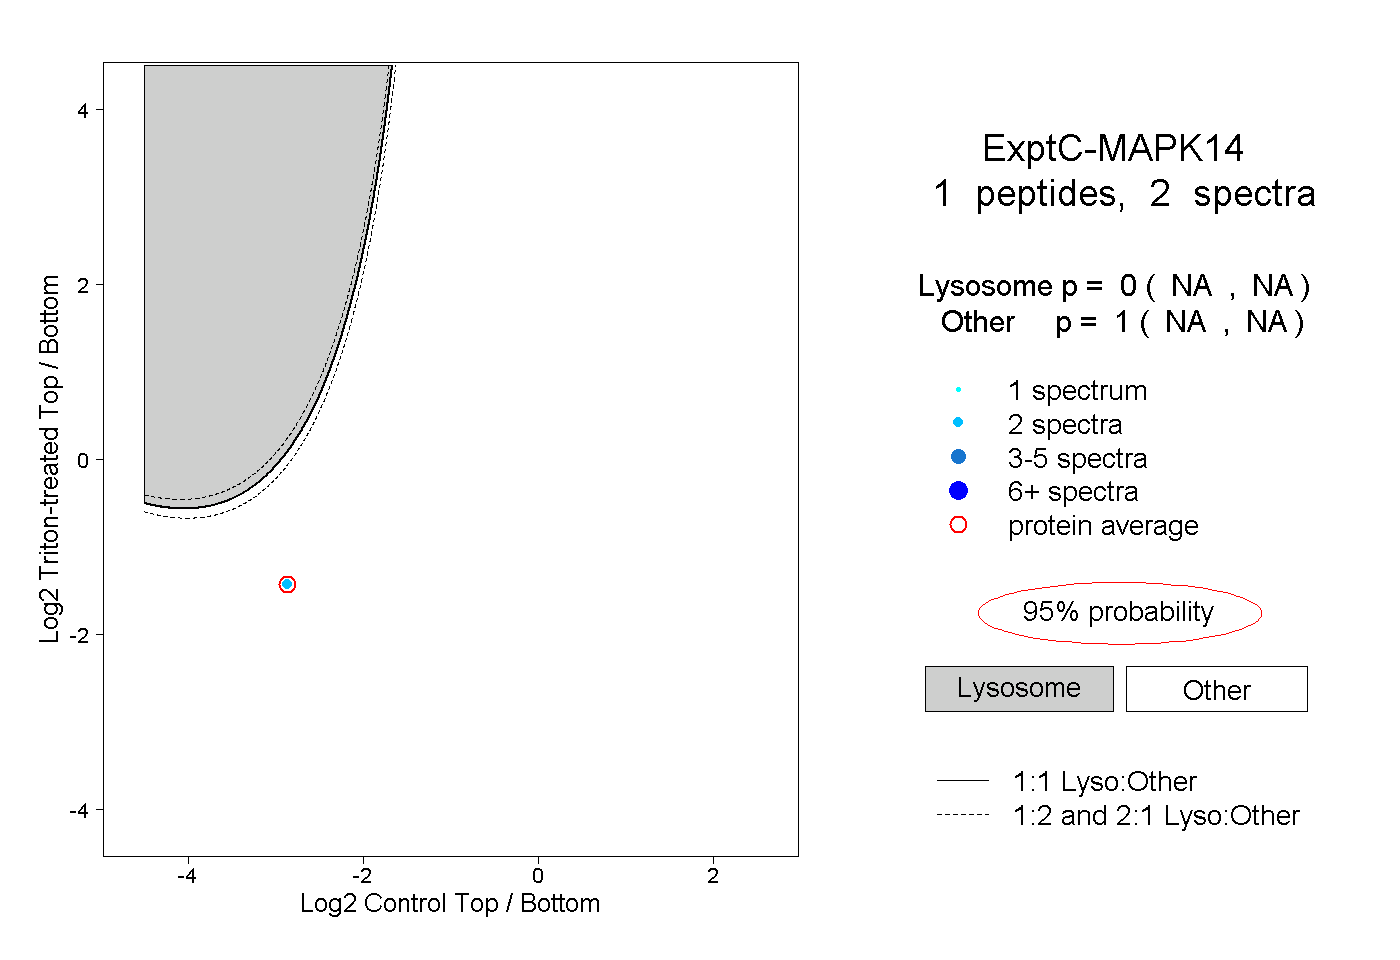
NA | NA
NA | NA