 8
8peptides
spectra
0.000 | 0.000
0.022 | 0.059
0.000 | 0.000
0.000 | 0.000
0.000 | 0.028
0.000 | 0.023
0.929 | 0.952
0.000 | 0.000
| Plot | Mito | Lyso | Perox | ER | Golgi | PM | Cytosol | Nucleus | |||||
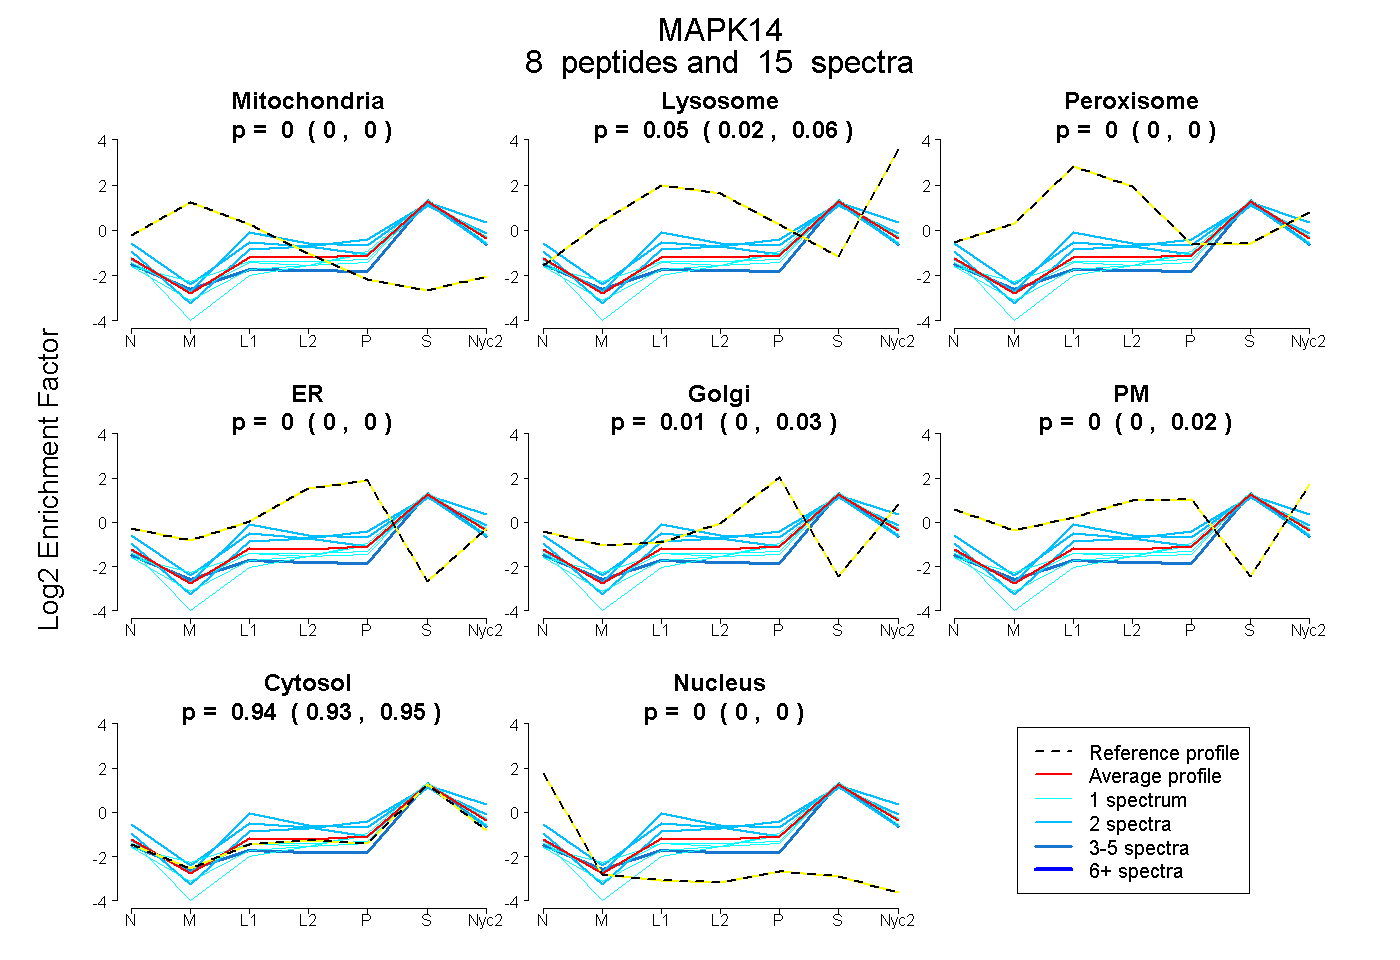
| Expt A |
8 peptides |
15 spectra |
|
0.000 0.000 | 0.000 |
0.045 0.022 | 0.059 |
0.000 0.000 | 0.000 |
0.000 0.000 | 0.000 |
0.013 0.000 | 0.028 |
0.000 0.000 | 0.023 |
0.941 0.929 | 0.952 |
0.000 0.000 | 0.000 |
| 1 spectrum, TLFPGTDHIDQLK | 0.000 | 0.055 | 0.000 | 0.000 | 0.000 | 0.000 | 0.945 | 0.000 | ||
| 2 spectra, HENVIGLLDVFTPAR | 0.000 | 0.000 | 0.000 | 0.135 | 0.000 | 0.000 | 0.865 | 0.000 | ||
| 2 spectra, LSSESAR | 0.000 | 0.000 | 0.140 | 0.000 | 0.000 | 0.071 | 0.788 | 0.000 | ||
| 1 spectrum, LVGTPGAELLK | 0.000 | 0.004 | 0.000 | 0.000 | 0.034 | 0.000 | 0.961 | 0.000 | ||
| 5 spectra, DLLIDEWK | 0.000 | 0.000 | 0.000 | 0.000 | 0.000 | 0.000 | 0.976 | 0.024 | ||
| 1 spectrum, YIHSADIIHR | 0.000 | 0.000 | 0.000 | 0.000 | 0.000 | 0.000 | 0.997 | 0.003 | ||
| 2 spectra, HTDDEMTGYVATR | 0.000 | 0.202 | 0.028 | 0.000 | 0.000 | 0.000 | 0.770 | 0.000 | ||
| 1 spectrum, LSRPFQSIIHAK | 0.000 | 0.000 | 0.000 | 0.000 | 0.000 | 0.000 | 1.000 | 0.000 |
| Plot | Mito | Lyso or Perox | ER | Golgi | PM | Cytosol | Nucleus | ||||||
| Expt B |
2 peptides |
2 spectra |
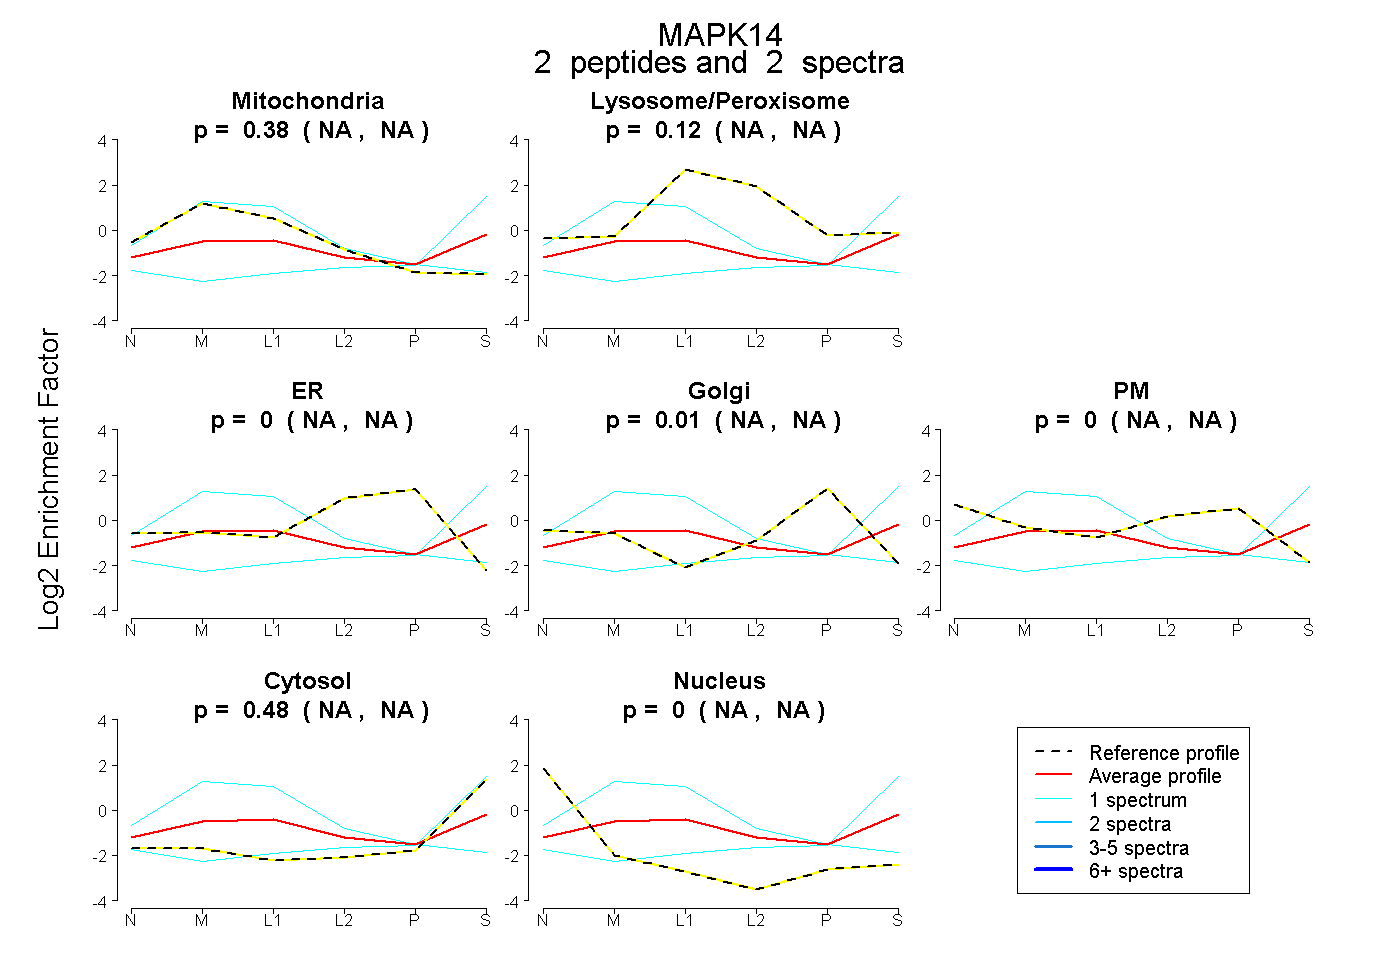 |
0.382 NA | NA |
0.124 NA | NA |
0.000 NA | NA |
0.011 NA | NA |
0.000 NA | NA |
0.483 NA | NA |
0.000 NA | NA |
|||
| Plot | Lyso | Other | |||||||||||
| Expt C |
1 peptide |
2 spectra |
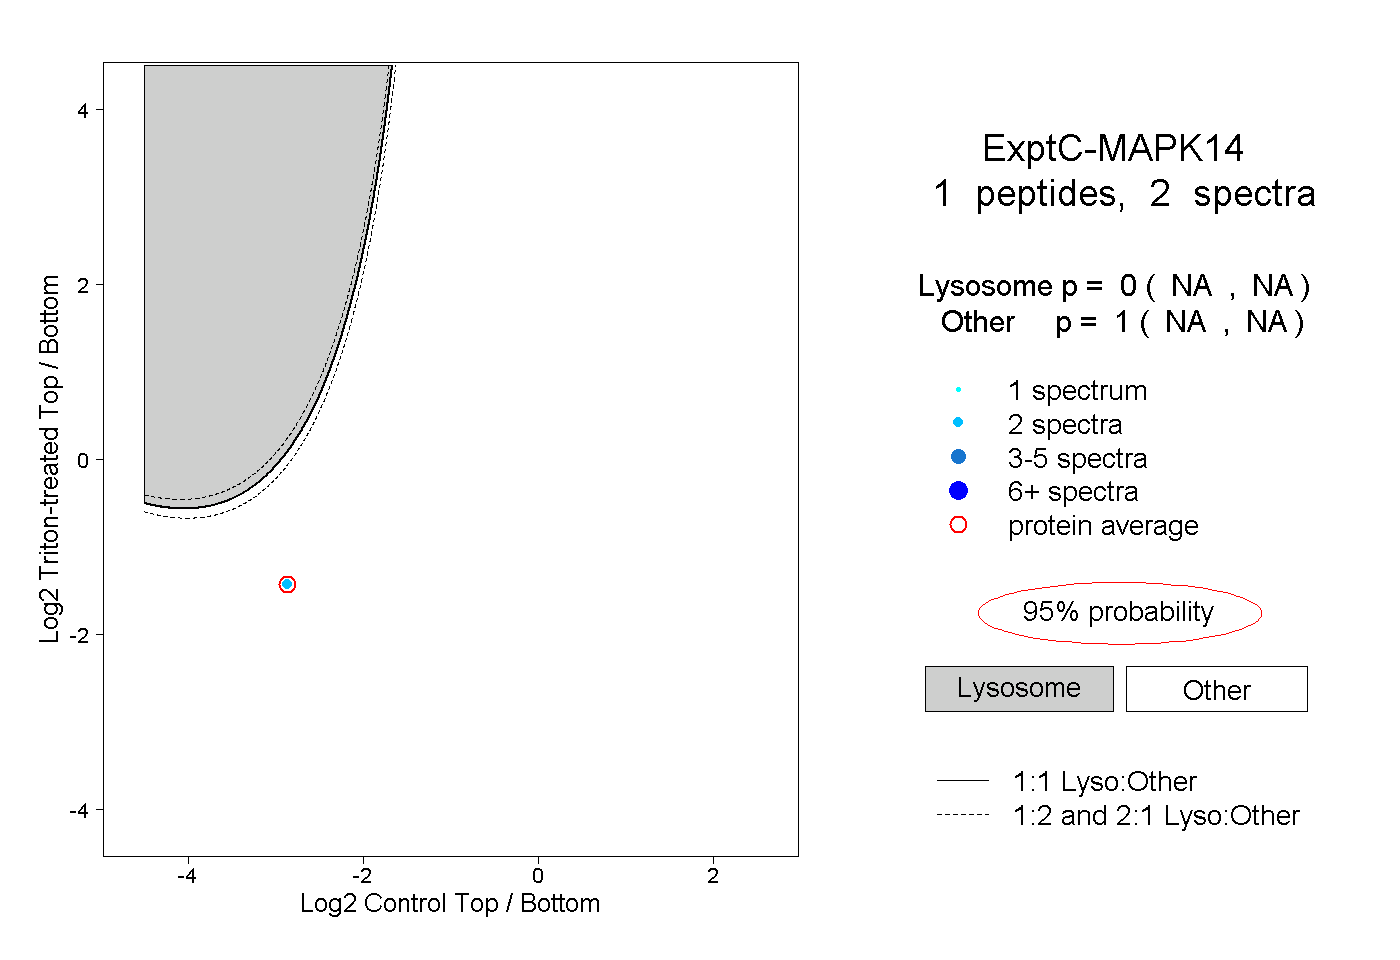 |
0.000 NA | NA |
1.000 NA | NA |