 8
8peptides
spectra
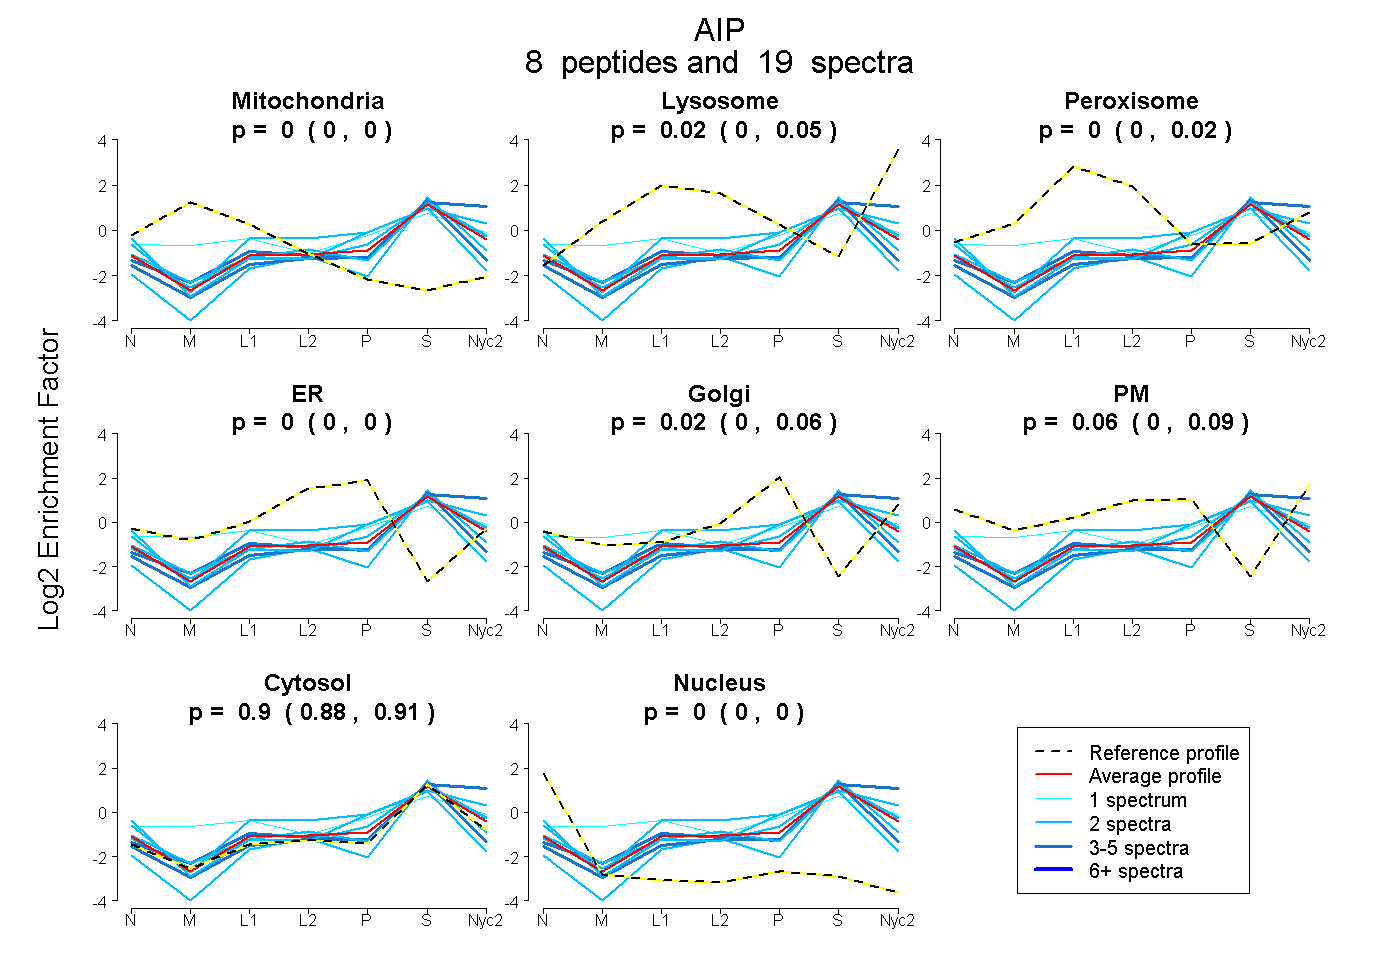
0.000 | 0.000
0.000 | 0.047
0.000 | 0.017
0.000 | 0.000
0.000 | 0.061
0.000 | 0.086
0.882 | 0.911
0.000 | 0.000
3peptides
spectra
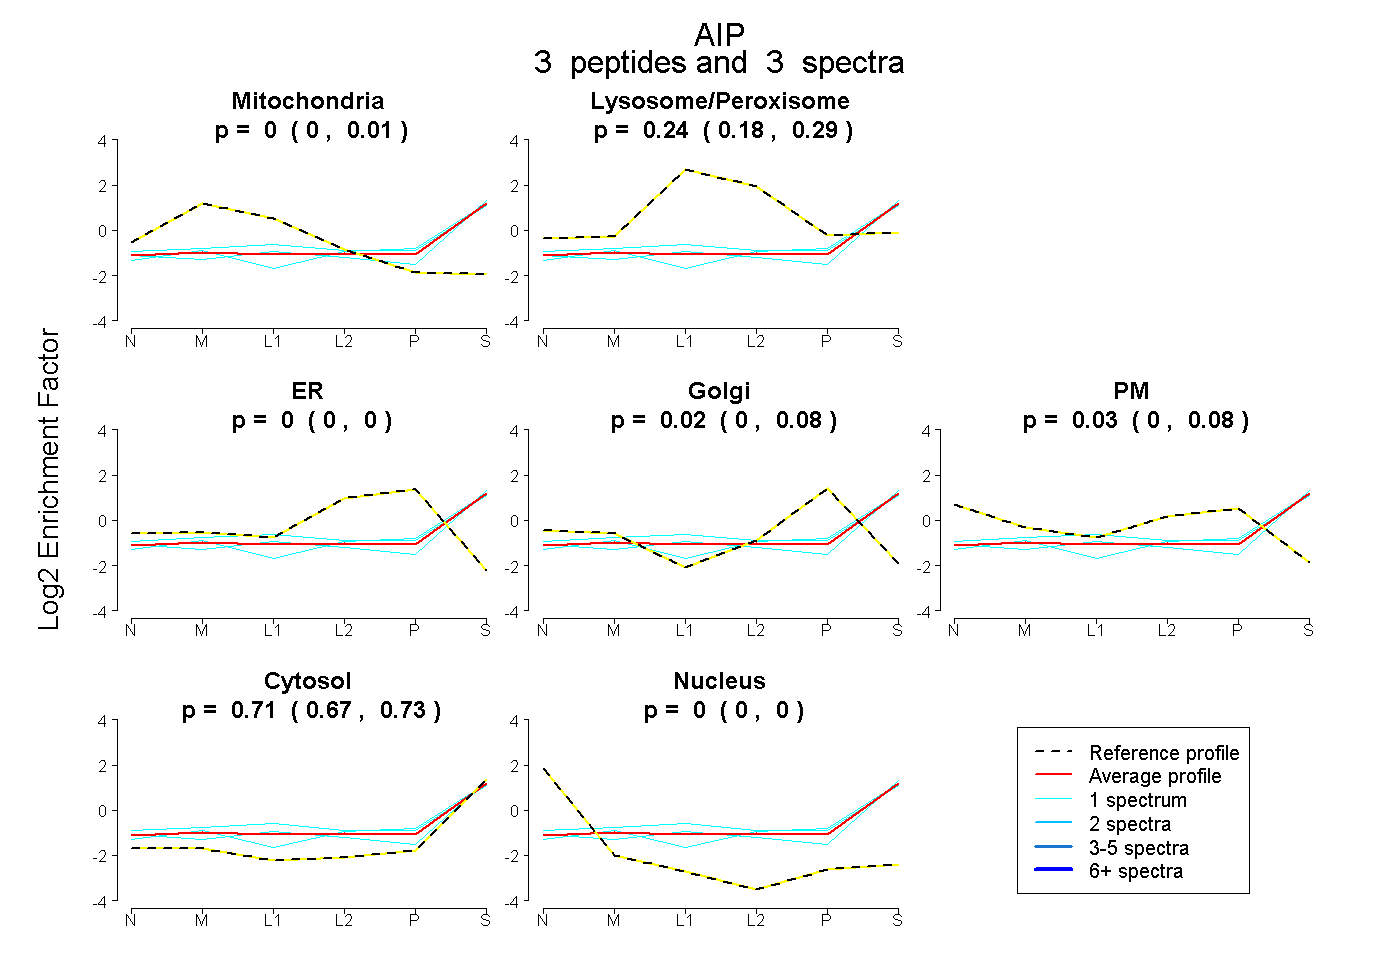
0.000 | 0.011
0.177 | 0.288
0.000 | 0.000
0.000 | 0.077
0.000 | 0.081
0.670 | 0.735
0.000 | 0.000
4peptides
spectra
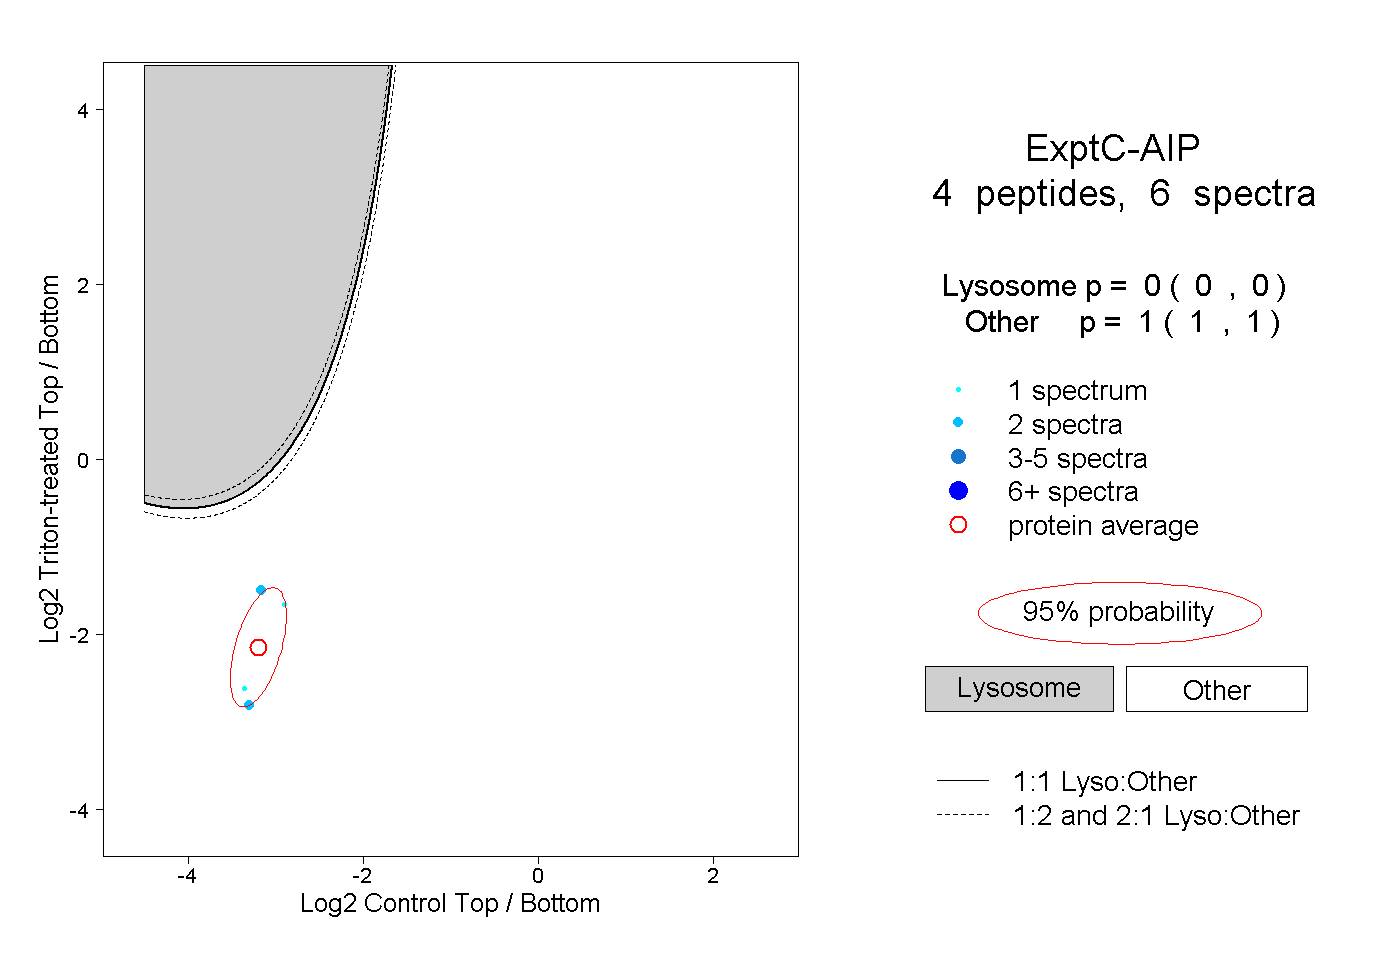
0.000 | 0.000
1.000 | 1.000