 8
8peptides
spectra
0.000 | 0.000
0.000 | 0.047
0.000 | 0.017
0.000 | 0.000
0.000 | 0.061
0.000 | 0.086
0.882 | 0.911
0.000 | 0.000
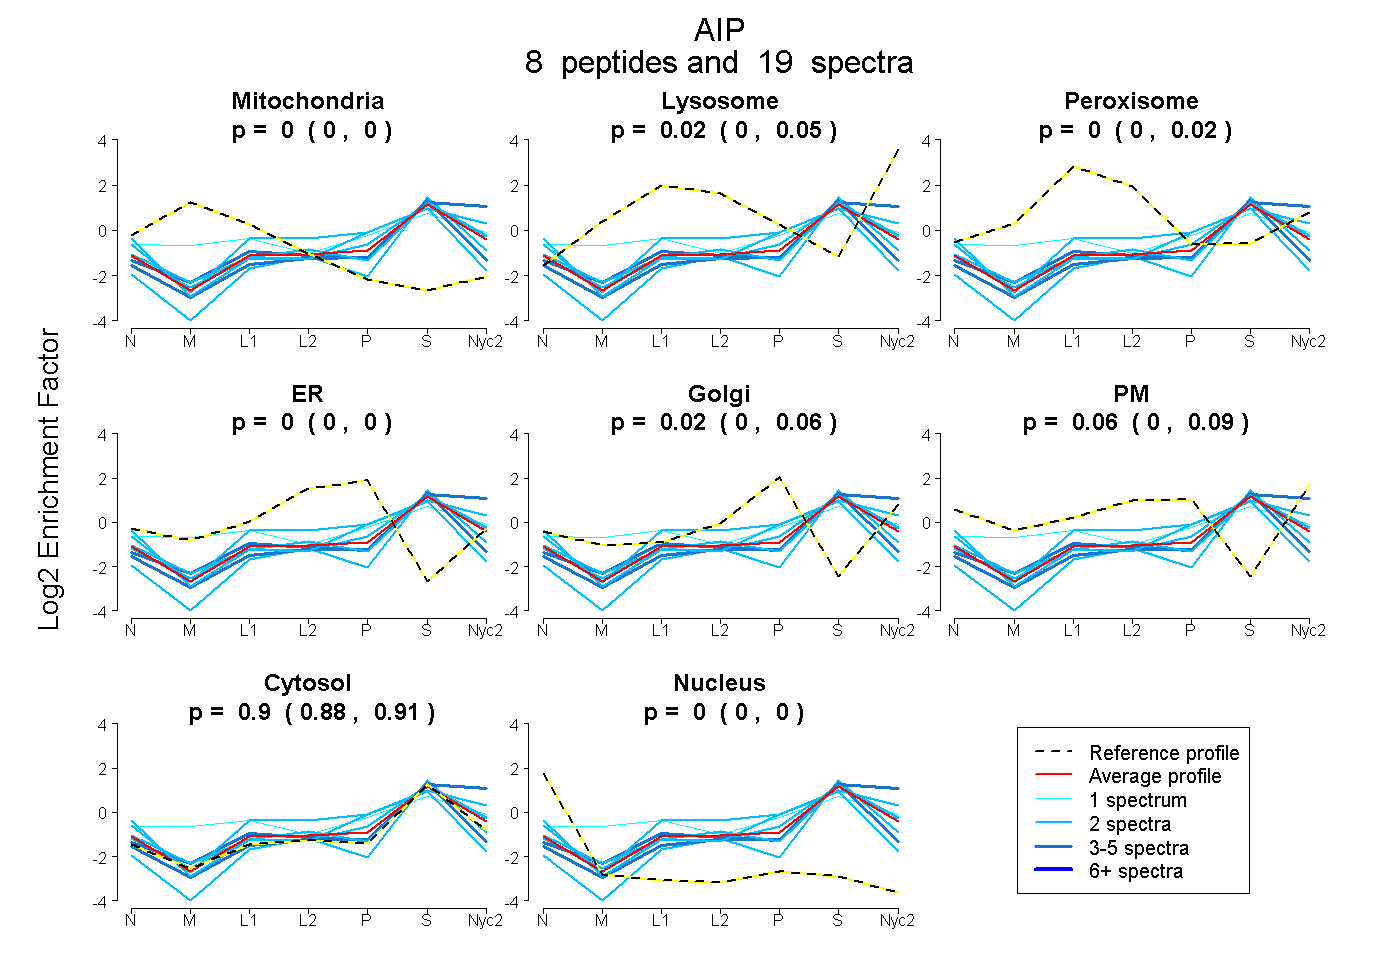
| Plot | Mito | Lyso | Perox | ER | Golgi | PM | Cytosol | Nucleus | |||||
| Expt A |
8 peptides |
19 spectra |
|
0.000 0.000 | 0.000 |
0.023 0.000 | 0.047 |
0.000 0.000 | 0.017 |
0.000 0.000 | 0.000 |
0.015 0.000 | 0.061 |
0.062 0.000 | 0.086 |
0.900 0.882 | 0.911 |
0.000 0.000 | 0.000 |
| 2 spectra, YDDNVK | 0.000 | 0.076 | 0.006 | 0.000 | 0.000 | 0.021 | 0.896 | 0.000 | ||
| 2 spectra, ATFHFR | 0.000 | 0.000 | 0.000 | 0.000 | 0.000 | 0.000 | 1.000 | 0.000 | ||
| 4 spectra, EGETAQFLCDVK | 0.000 | 0.000 | 0.000 | 0.000 | 0.000 | 0.000 | 0.983 | 0.017 | ||
| 4 spectra, GELPEFQDGTK | 0.000 | 0.200 | 0.000 | 0.000 | 0.000 | 0.000 | 0.800 | 0.000 | ||
| 2 spectra, TLHSDPEGSVIDDSR | 0.000 | 0.087 | 0.021 | 0.000 | 0.000 | 0.180 | 0.712 | 0.000 | ||
| 2 spectra, YYDAIACLK | 0.000 | 0.000 | 0.000 | 0.124 | 0.000 | 0.000 | 0.767 | 0.108 | ||
| 2 spectra, AVPLIHQEGNR | 0.000 | 0.025 | 0.000 | 0.000 | 0.102 | 0.000 | 0.873 | 0.000 | ||
| 1 spectrum, ADLIAR | 0.078 | 0.071 | 0.138 | 0.000 | 0.144 | 0.000 | 0.569 | 0.000 |
| Plot | Mito | Lyso or Perox | ER | Golgi | PM | Cytosol | Nucleus | ||||||
| Expt B |
3 peptides |
3 spectra |
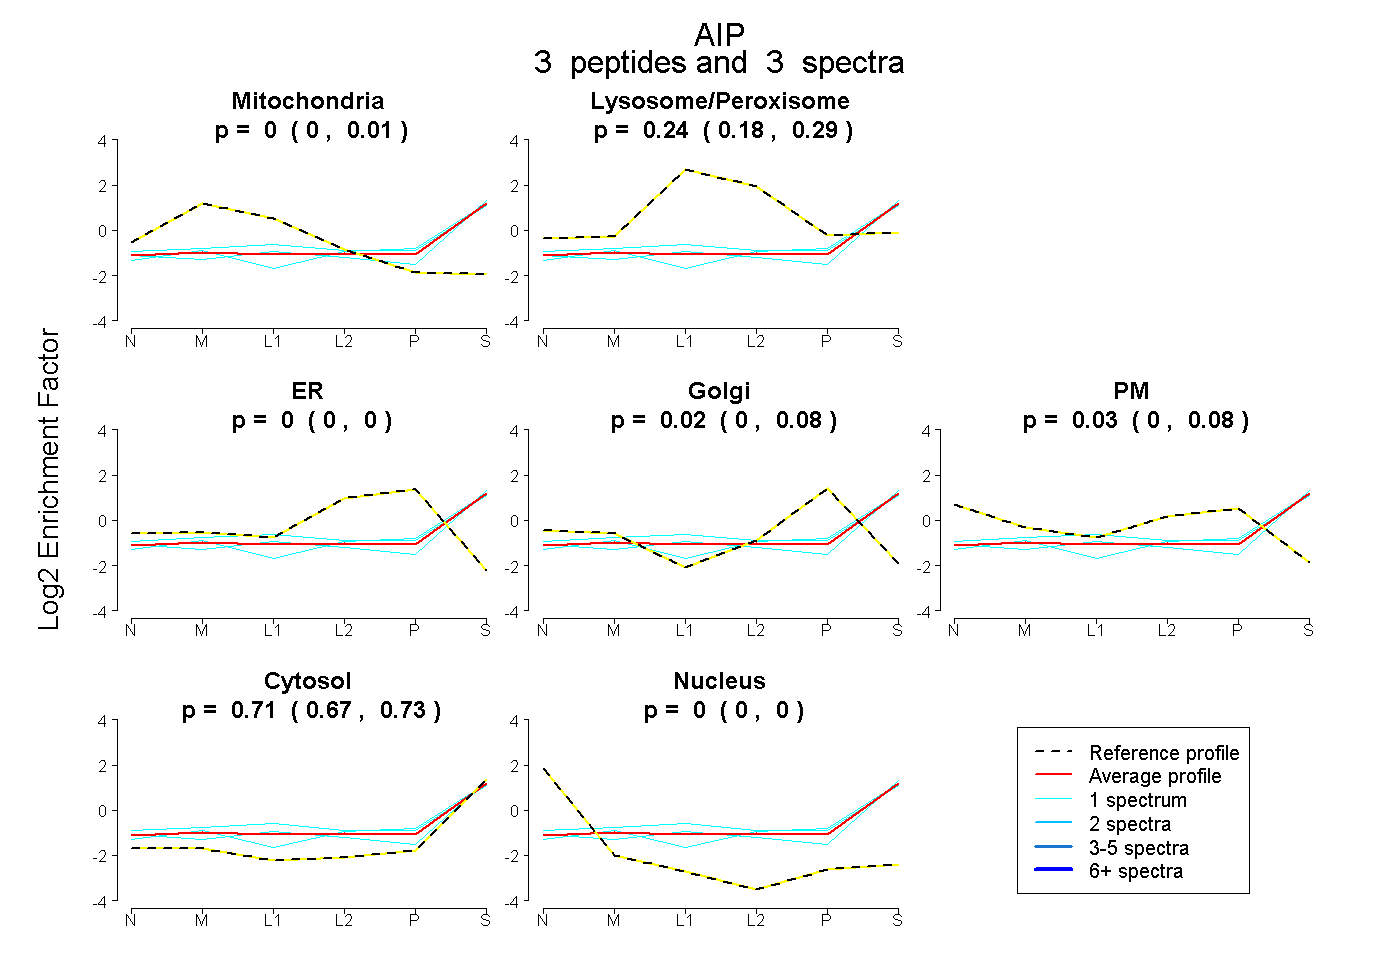 |
0.000 0.000 | 0.011 |
0.241 0.177 | 0.288 |
0.000 0.000 | 0.000 |
0.017 0.000 | 0.077 |
0.033 0.000 | 0.081 |
0.709 0.670 | 0.735 |
0.000 0.000 | 0.000 |
|||
| Plot | Lyso | Other | |||||||||||
| Expt C |
4 peptides |
6 spectra |
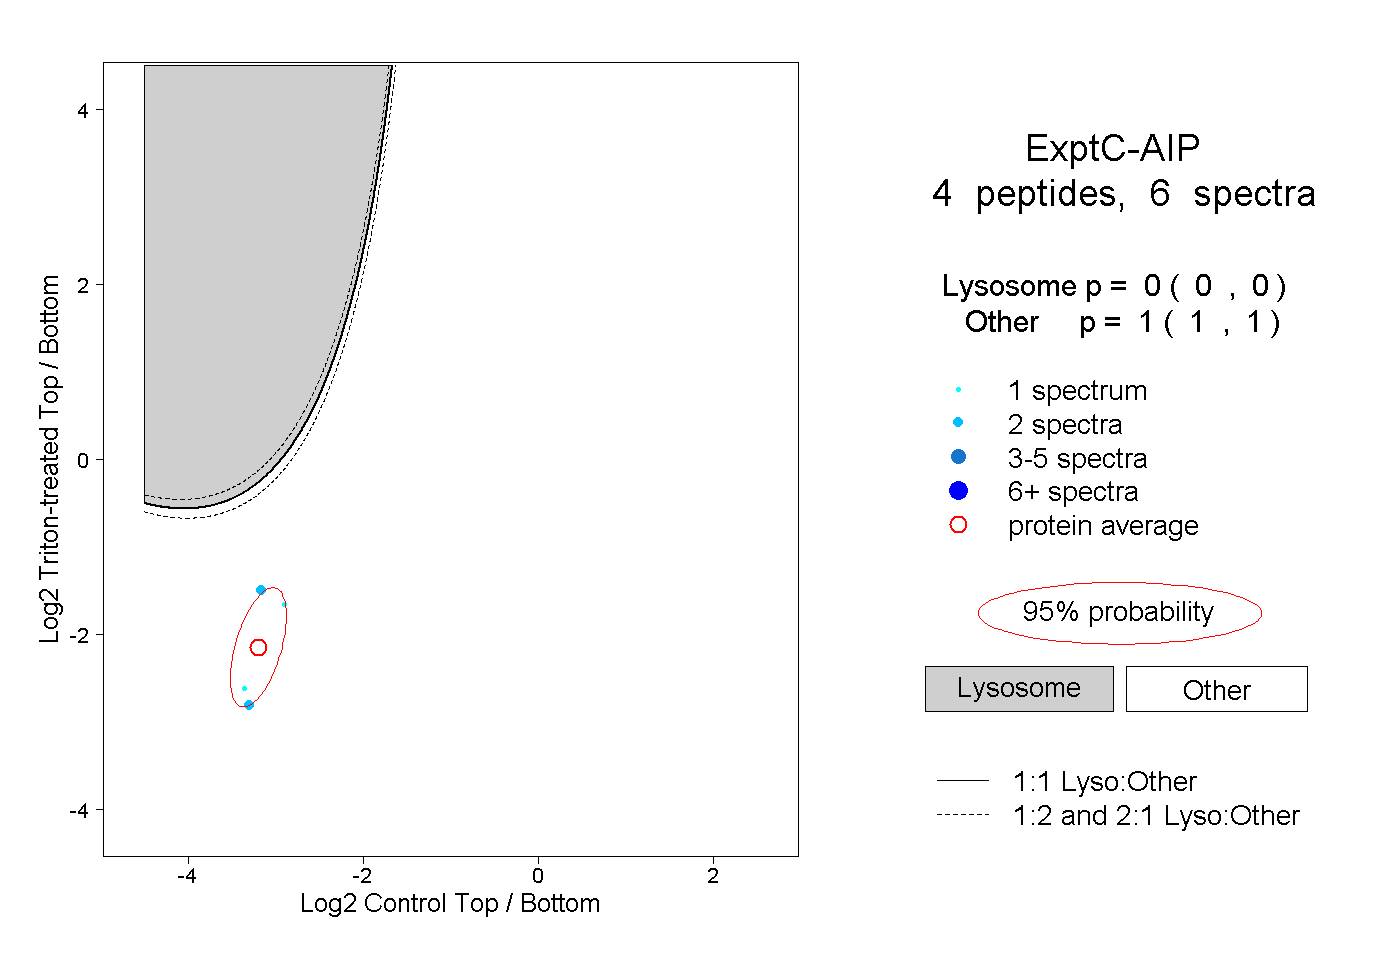 |
0.000 0.000 | 0.000 |
1.000 1.000 | 1.000 |