 9
9peptides
spectra

0.000 | 0.000
0.000 | 0.000
0.000 | 0.000
0.000 | 0.000
0.000 | 0.012
0.132 | 0.152
0.847 | 0.856
0.000 | 0.000
4peptides
spectra
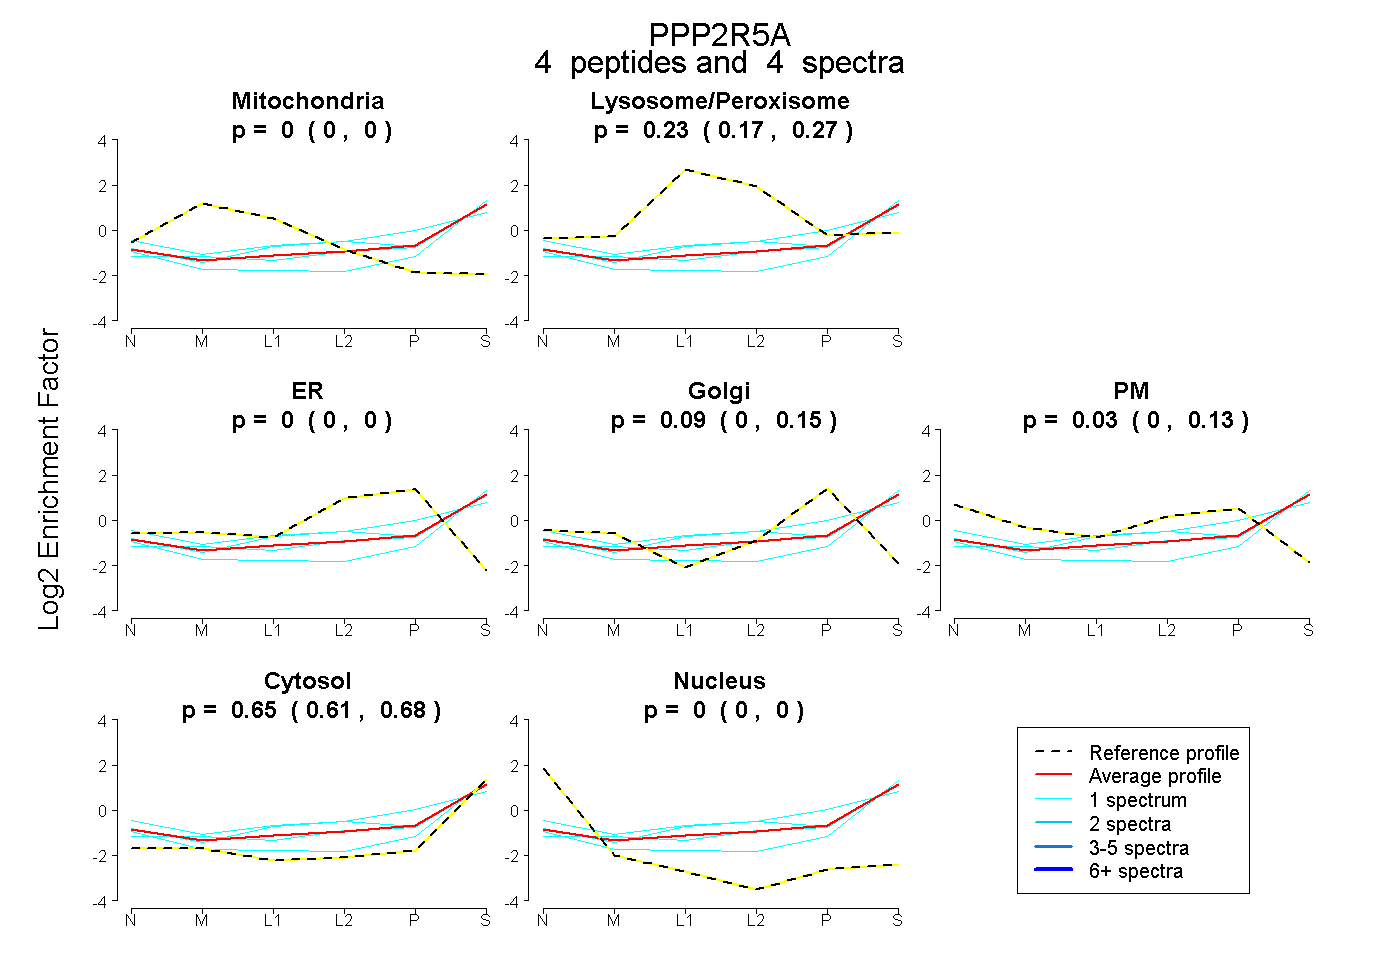
0.000 | 0.000
0.171 | 0.268
0.000 | 0.000
0.000 | 0.150
0.000 | 0.128
0.608 | 0.684
0.000 | 0.000
8peptides
spectra
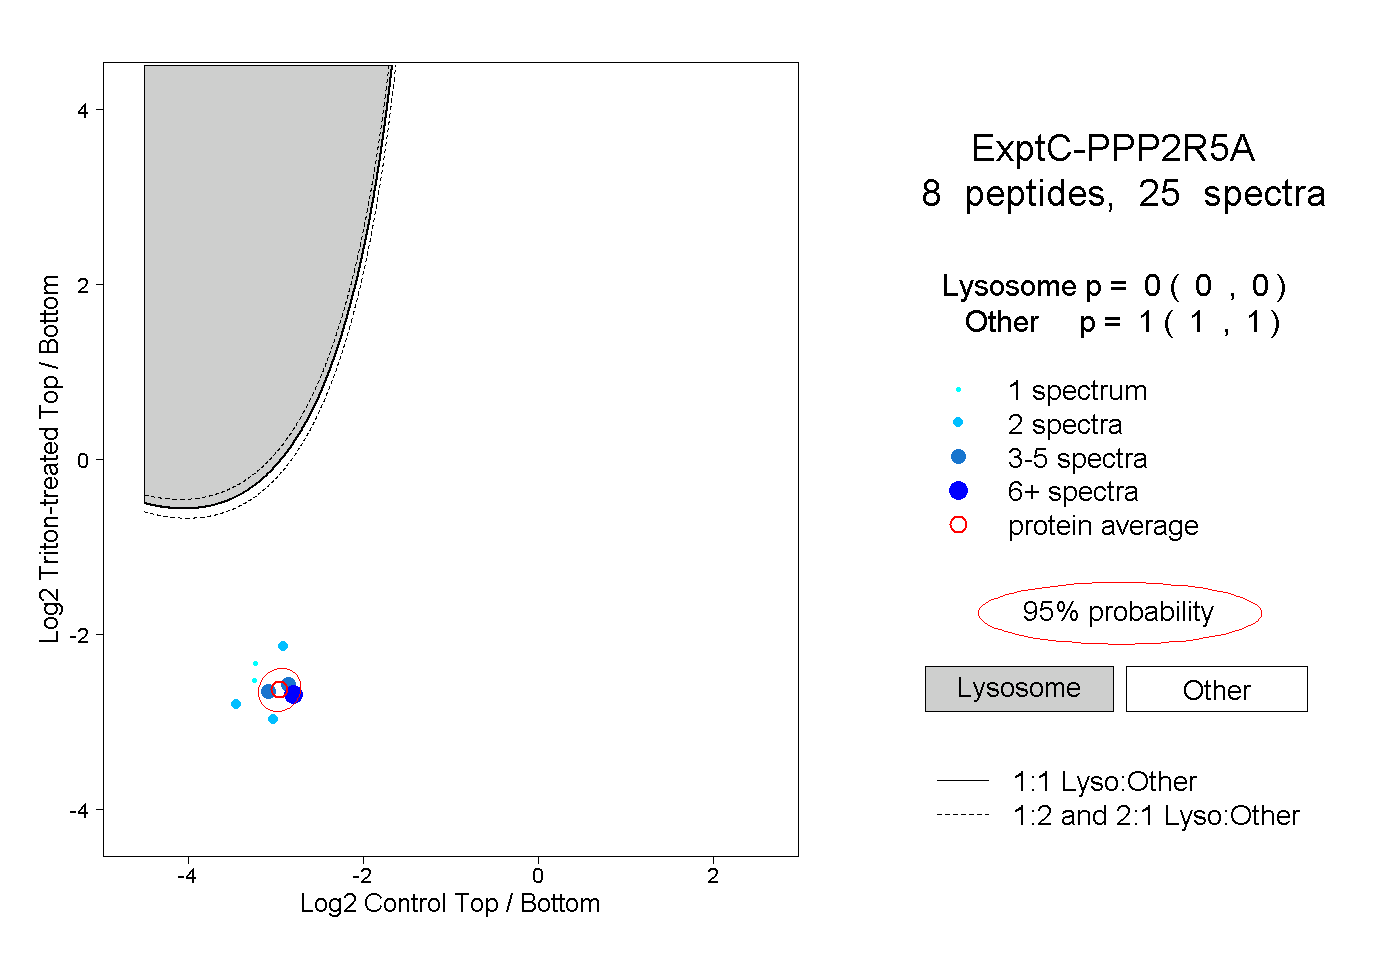
0.000 | 0.000
1.000 | 1.000
2peptides
spectra
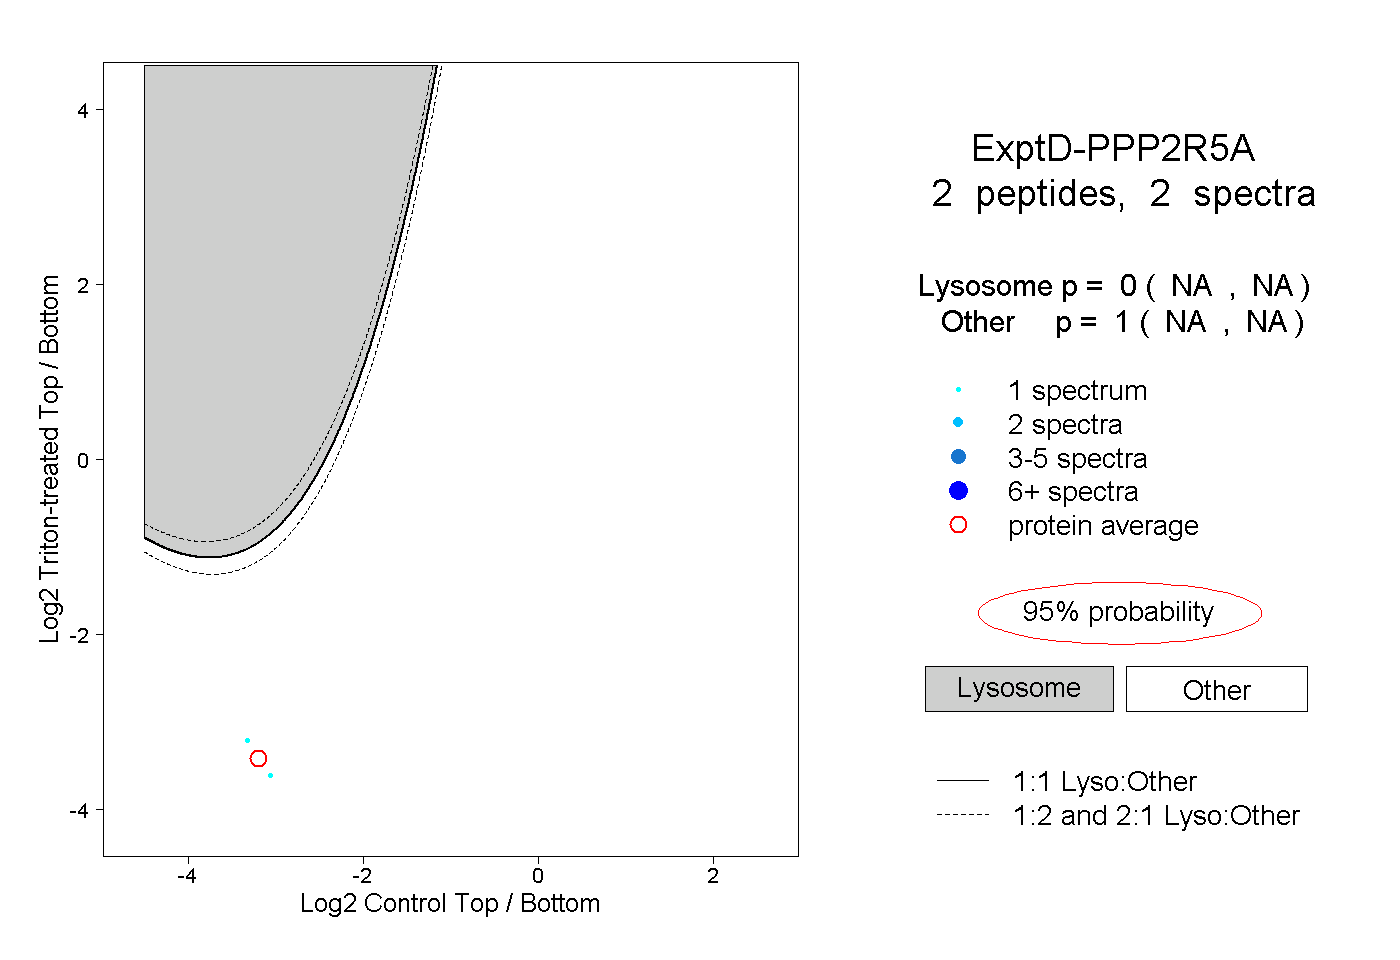
NA | NA
NA | NA