 9
9peptides
spectra

0.000 | 0.000
0.000 | 0.000
0.000 | 0.000
0.000 | 0.000
0.000 | 0.012
0.132 | 0.152
0.847 | 0.856
0.000 | 0.000
| Plot | Mito | Lyso | Perox | ER | Golgi | PM | Cytosol | Nucleus | |||||
| Expt A |
9 peptides |
26 spectra |
|
0.000 0.000 | 0.000 |
0.000 0.000 | 0.000 |
0.000 0.000 | 0.000 |
0.000 0.000 | 0.000 |
0.000 0.000 | 0.012 |
0.147 0.132 | 0.152 |
0.853 0.847 | 0.856 |
0.000 0.000 | 0.000 |
| 6 spectra, VLIPMHTAK | 0.000 | 0.033 | 0.000 | 0.000 | 0.000 | 0.166 | 0.801 | 0.000 | ||
| 2 spectra, DTTLTEPVIR | 0.000 | 0.000 | 0.000 | 0.000 | 0.022 | 0.052 | 0.905 | 0.022 | ||
| 8 spectra, SQGSSQFR | 0.000 | 0.000 | 0.014 | 0.000 | 0.000 | 0.206 | 0.780 | 0.000 | ||
| 1 spectrum, DATSNEQQELFCQK | 0.000 | 0.000 | 0.000 | 0.079 | 0.000 | 0.000 | 0.921 | 0.000 | ||
| 4 spectra, MISANIFR | 0.000 | 0.000 | 0.021 | 0.000 | 0.055 | 0.100 | 0.824 | 0.000 | ||
| 1 spectrum, GVIVESAYSDIVK | 0.000 | 0.000 | 0.000 | 0.000 | 0.014 | 0.139 | 0.847 | 0.000 | ||
| 1 spectrum, VDGFTR | 0.000 | 0.000 | 0.061 | 0.000 | 0.000 | 0.211 | 0.727 | 0.000 | ||
| 2 spectra, ATLNELVEYVSTNR | 0.000 | 0.000 | 0.000 | 0.000 | 0.033 | 0.067 | 0.893 | 0.007 | ||
| 1 spectrum, LFDDLTSSYK | 0.000 | 0.000 | 0.000 | 0.000 | 0.038 | 0.000 | 0.923 | 0.040 |
| Plot | Mito | Lyso or Perox | ER | Golgi | PM | Cytosol | Nucleus | ||||||
| Expt B |
4 peptides |
4 spectra |
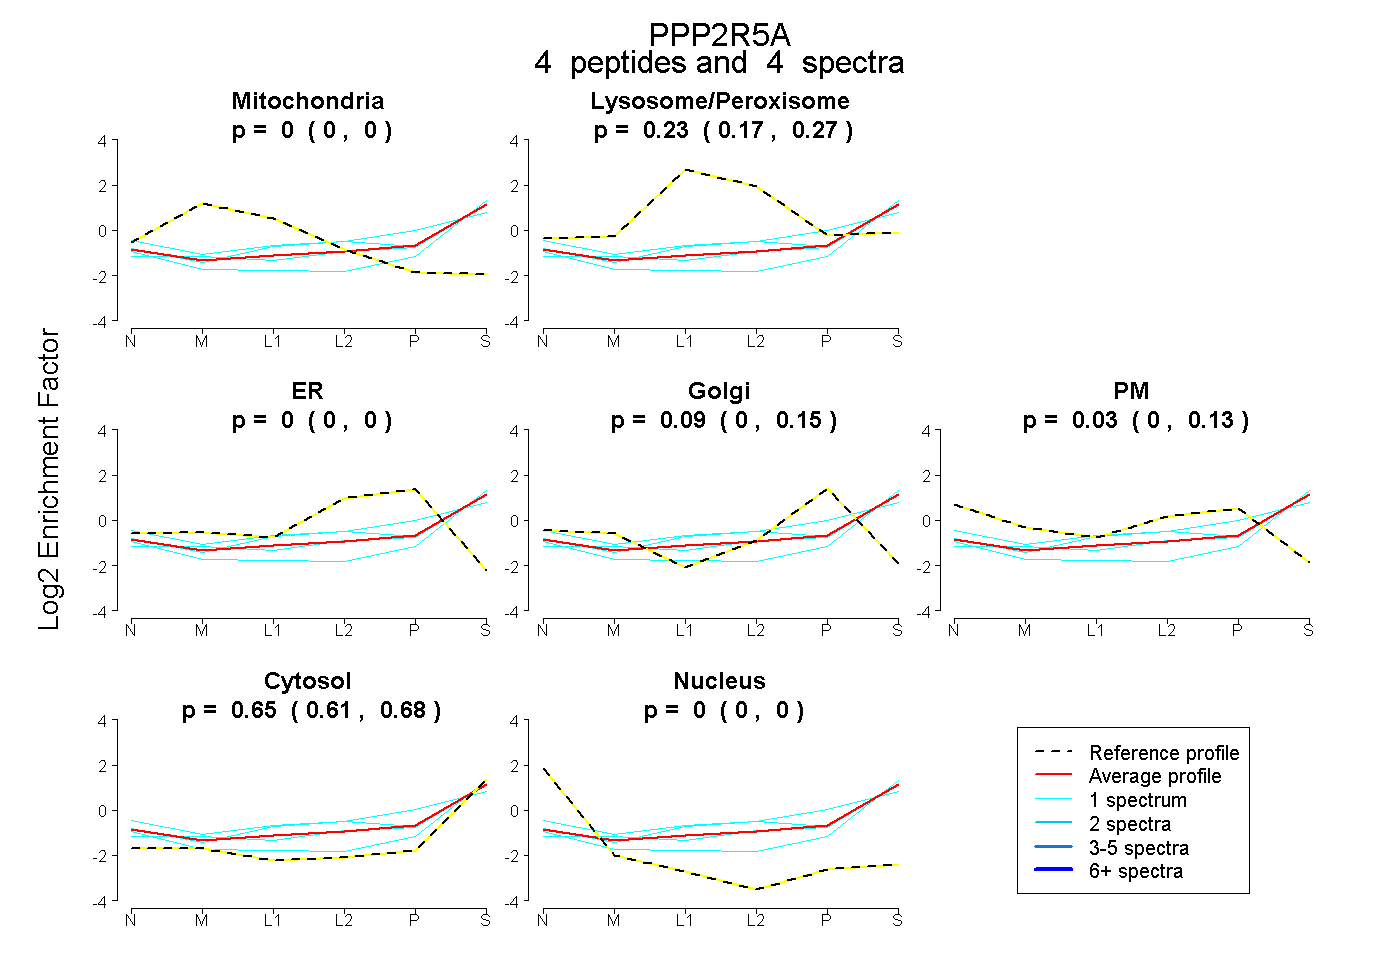 |
0.000 0.000 | 0.000 |
0.230 0.171 | 0.268 |
0.000 0.000 | 0.000 |
0.092 0.000 | 0.150 |
0.029 0.000 | 0.128 |
0.648 0.608 | 0.684 |
0.000 0.000 | 0.000 |
|||
| Plot | Lyso | Other | |||||||||||
| Expt C |
8 peptides |
25 spectra |
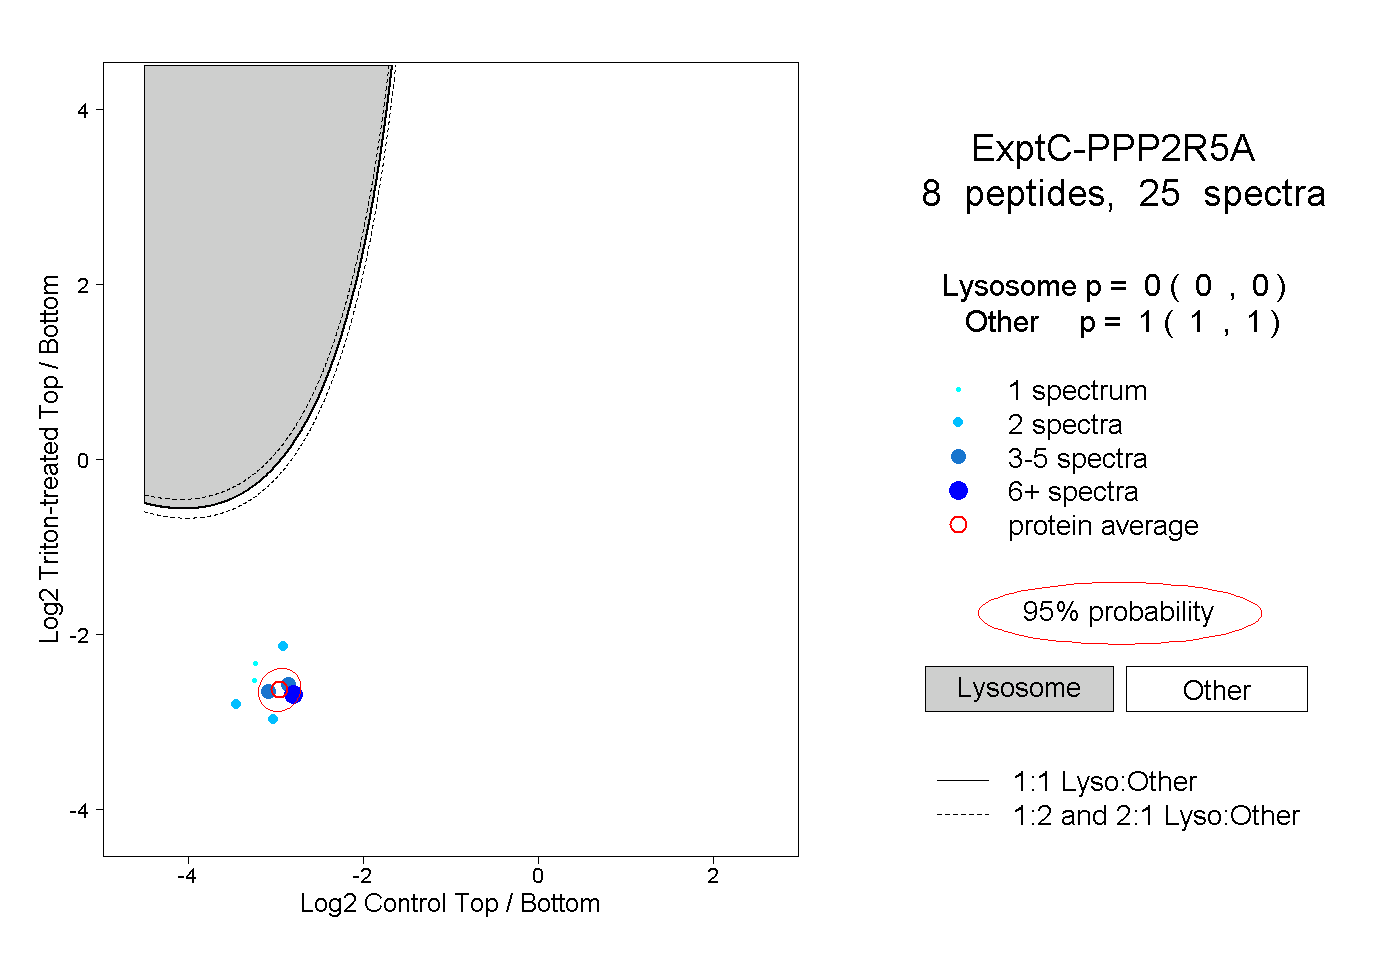 |
0.000 0.000 | 0.000 |
1.000 1.000 | 1.000 |
||||||||
| Plot | Lyso | Other | |||||||||||
| Expt D |
2 peptides |
2 spectra |
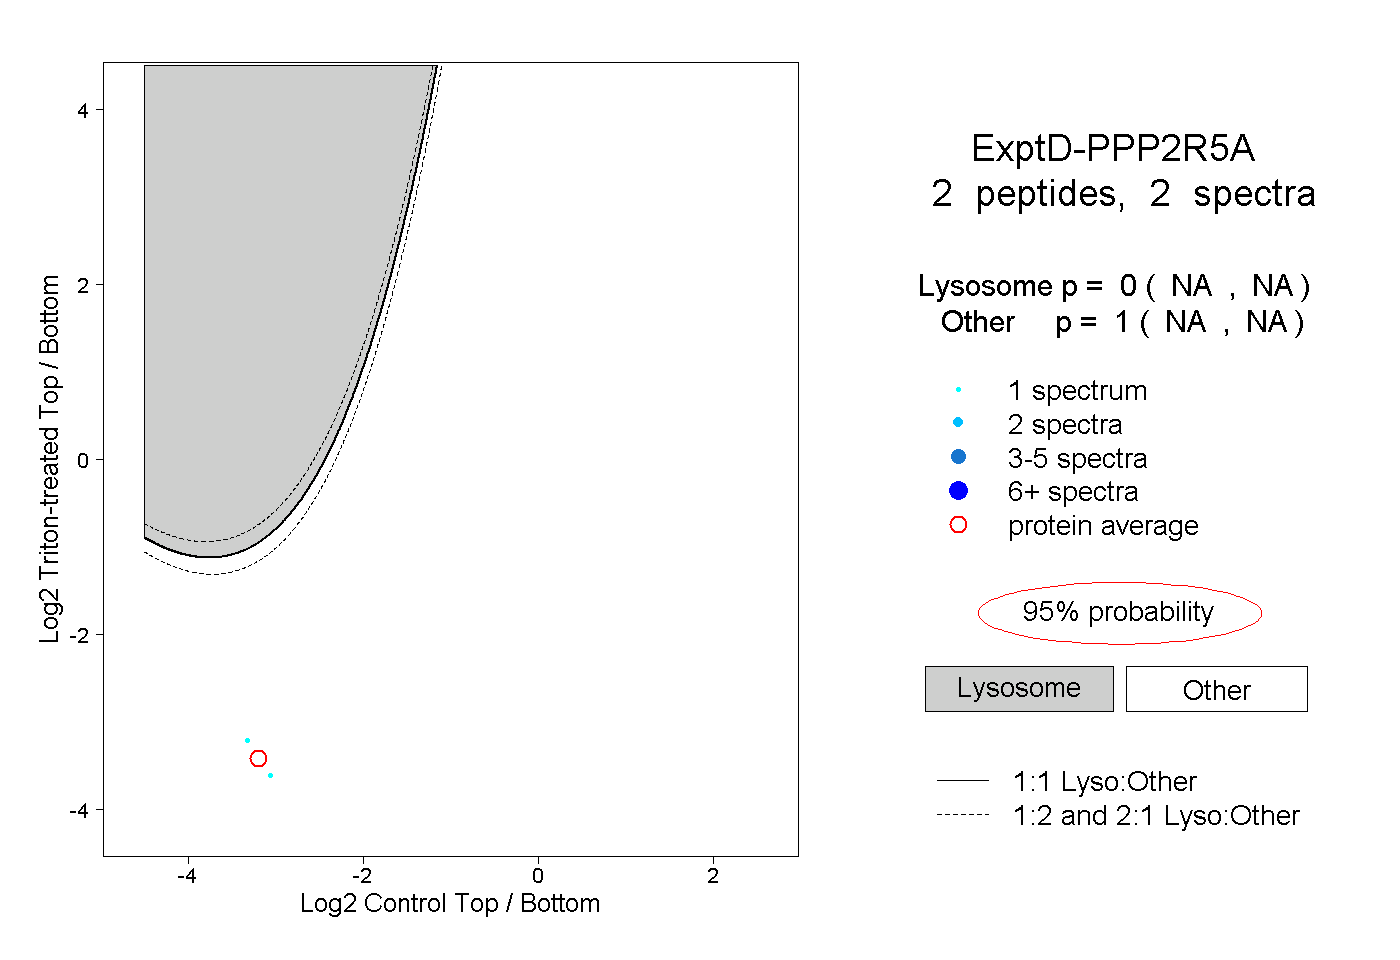 |
0.000 NA | NA |
1.000 NA | NA |