 13
13peptides
spectra
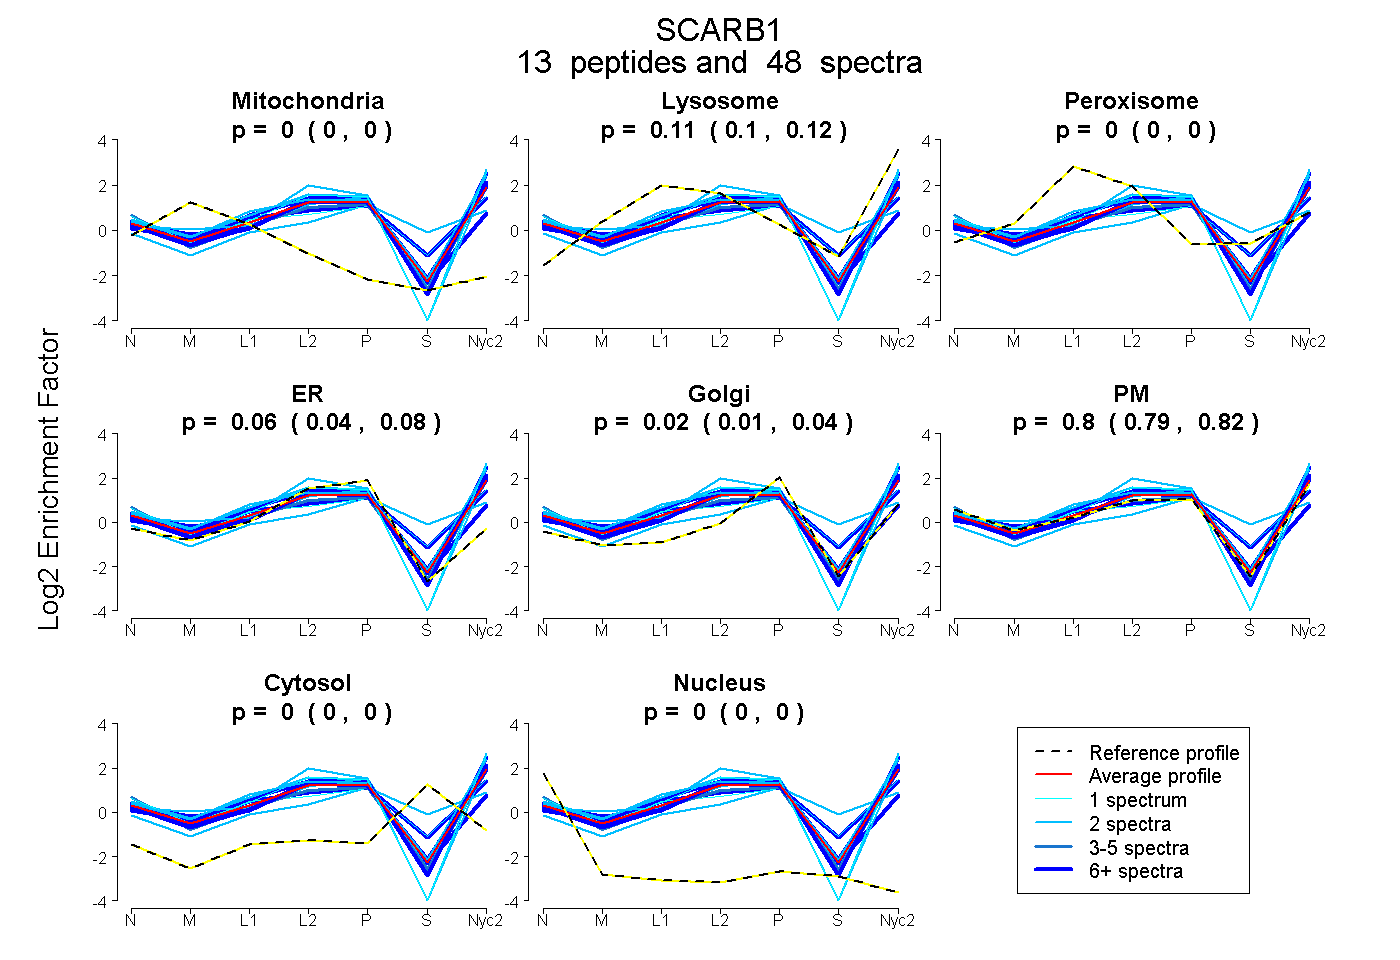
0.000 | 0.000
0.100 | 0.117
0.000 | 0.000
0.043 | 0.078
0.011 | 0.036
0.787 | 0.818
0.000 | 0.000
0.000 | 0.000
3peptides
spectra
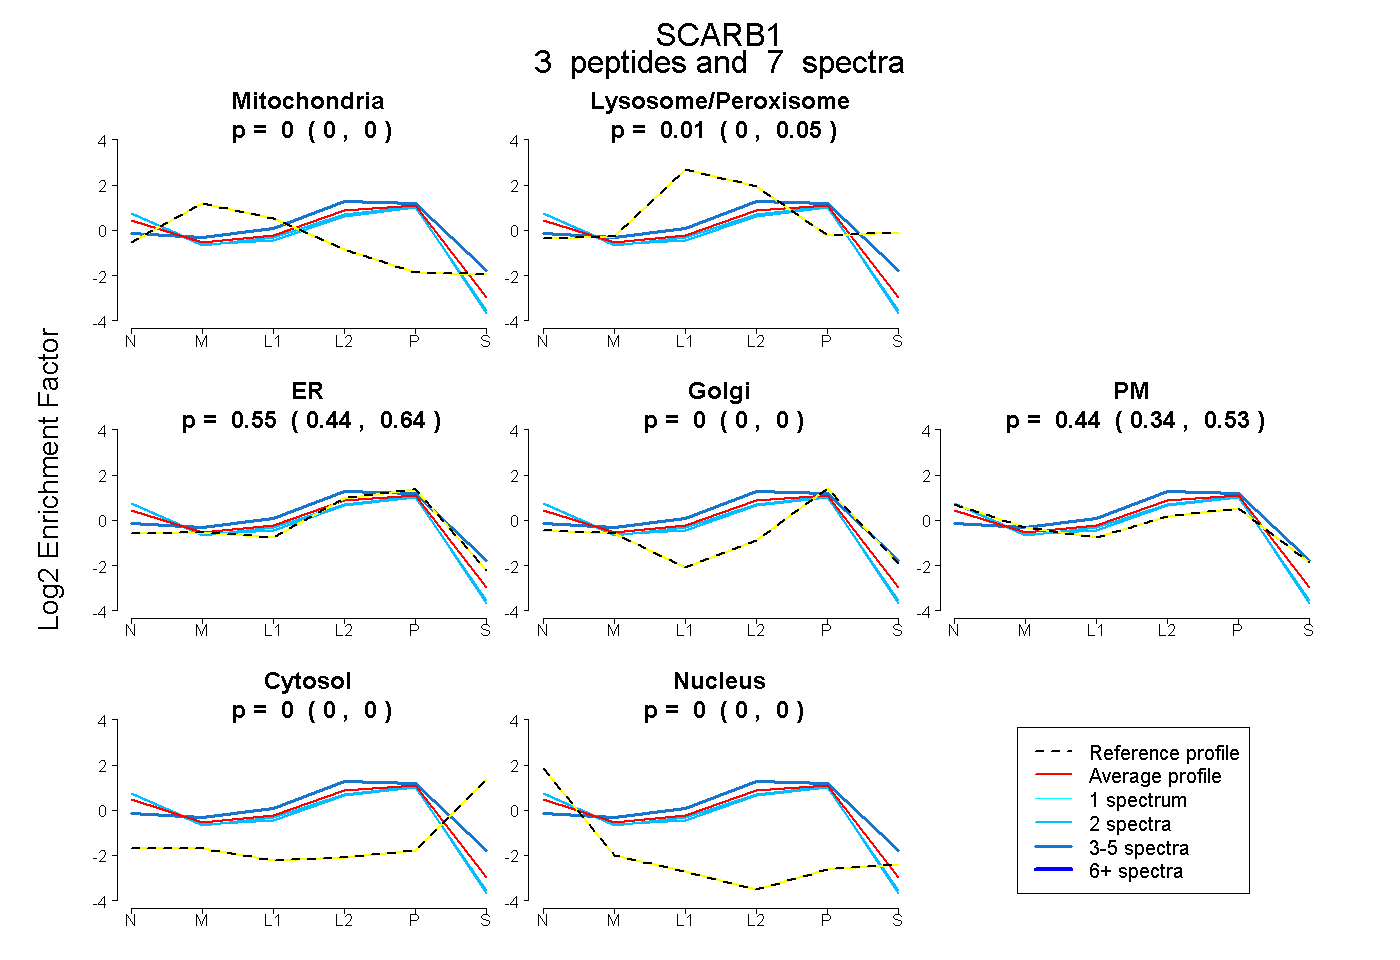
0.000 | 0.000
0.000 | 0.050
0.438 | 0.638
0.000 | 0.000
0.335 | 0.527
0.000 | 0.000
0.000 | 0.000
11peptides
spectra
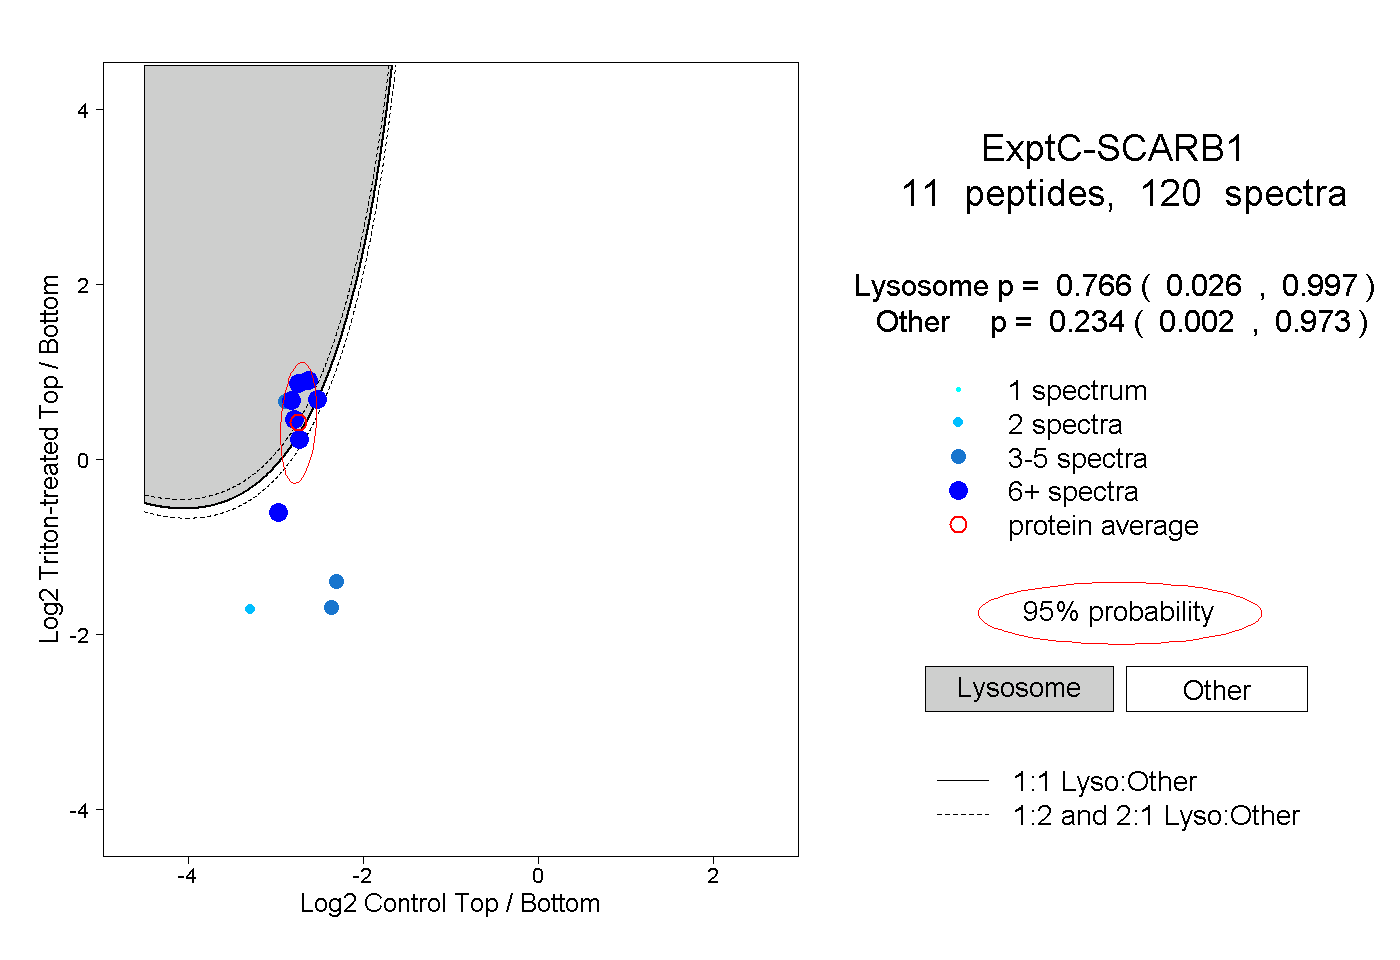
0.026 | 0.997
0.002 | 0.973
4peptides
spectra
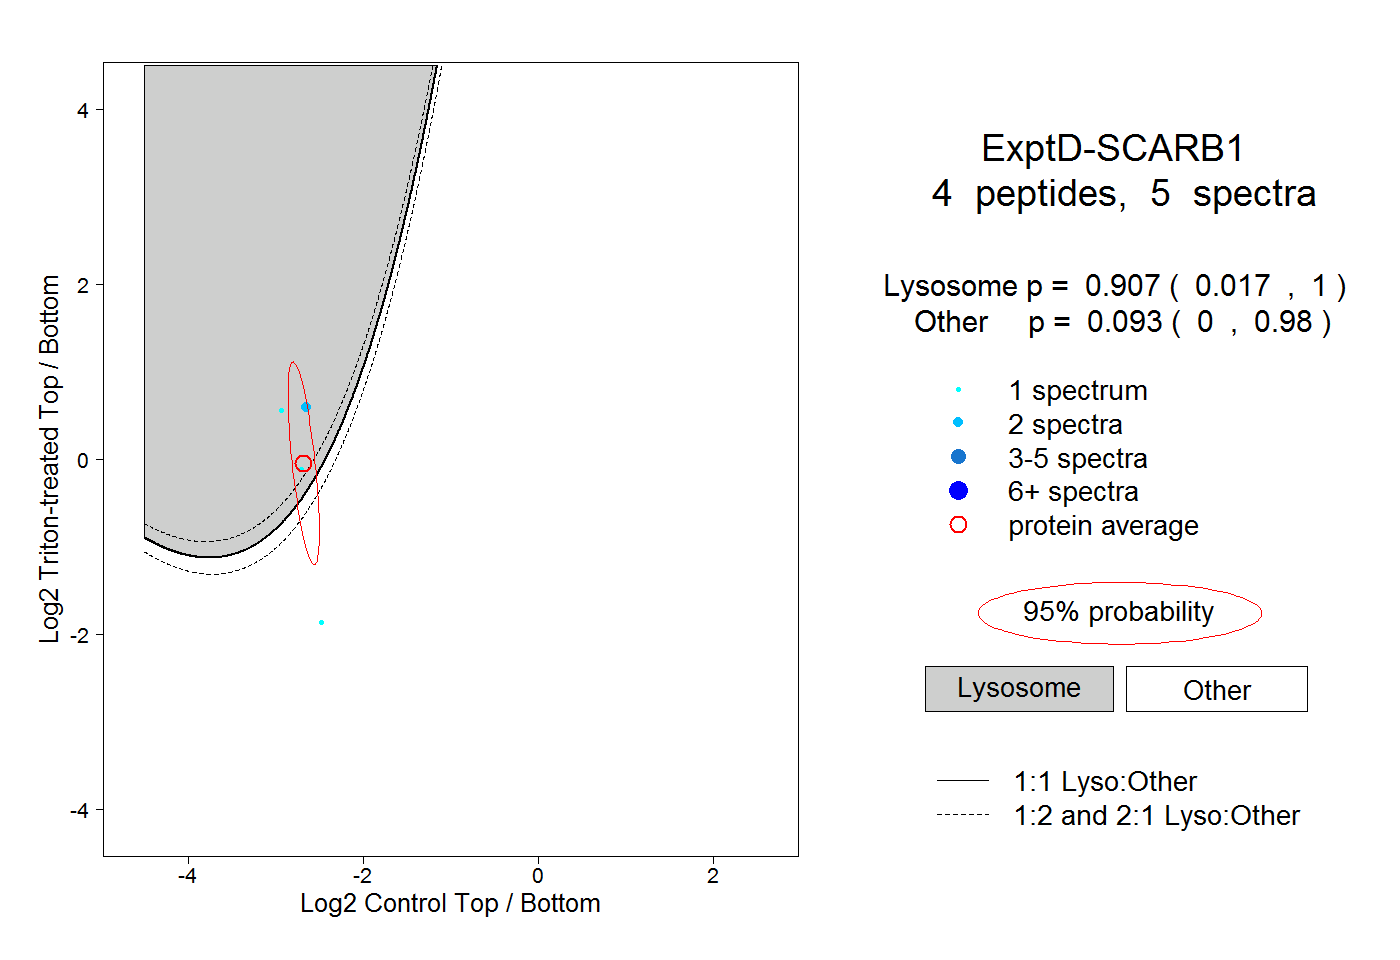
0.017 | 1.000
0.000 | 0.980