 13
13peptides
spectra
0.000 | 0.000
0.100 | 0.117
0.000 | 0.000
0.043 | 0.078
0.011 | 0.036
0.787 | 0.818
0.000 | 0.000
0.000 | 0.000
| Plot | Mito | Lyso | Perox | ER | Golgi | PM | Cytosol | Nucleus | |||||
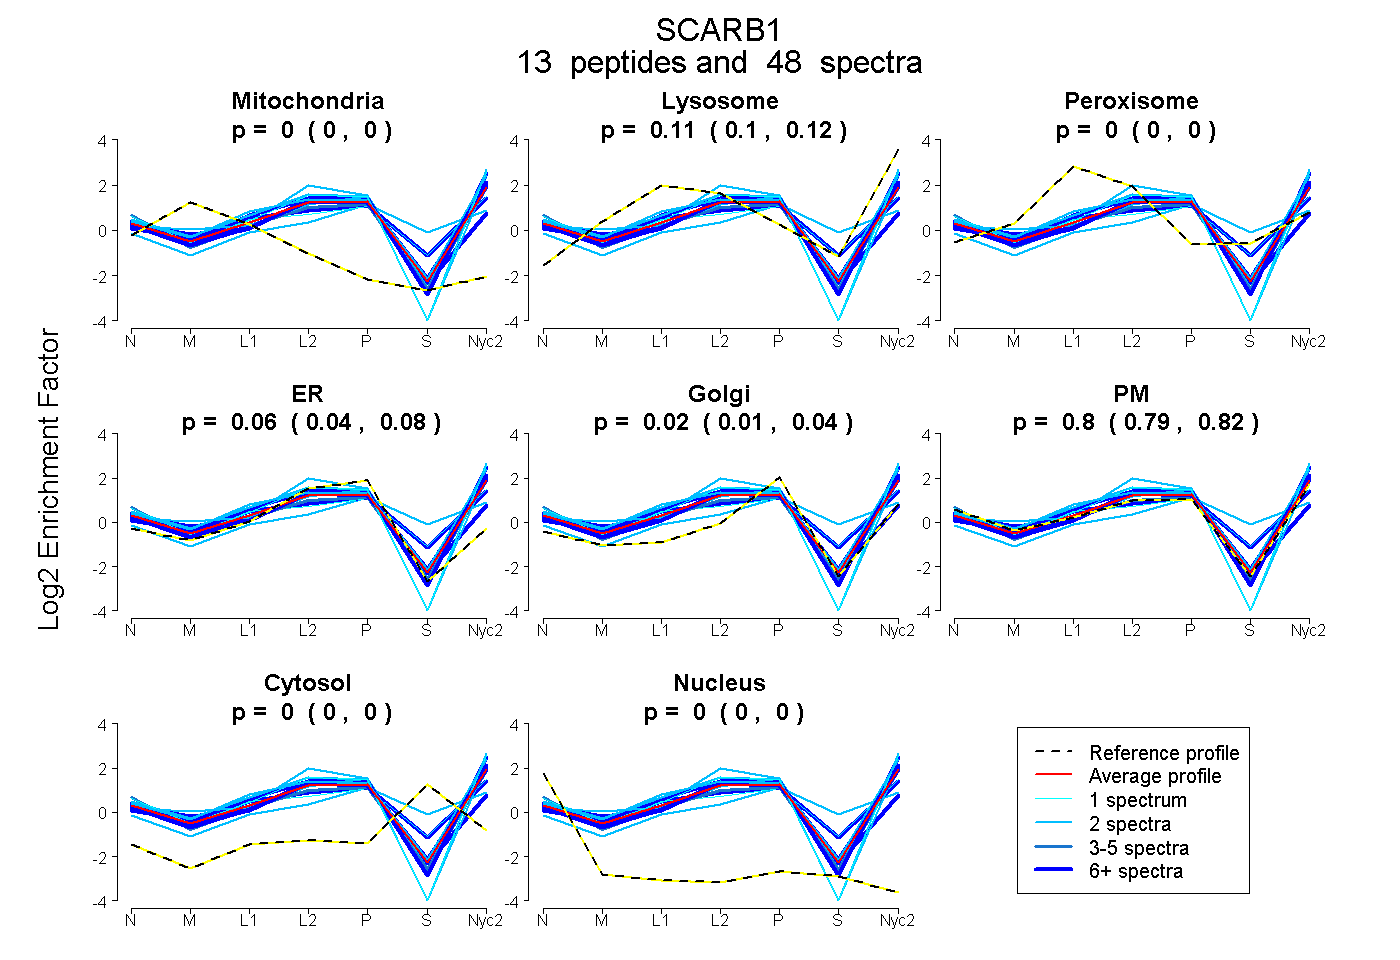
| Expt A |
13 peptides |
48 spectra |
|
0.000 0.000 | 0.000 |
0.109 0.100 | 0.117 |
0.000 0.000 | 0.000 |
0.063 0.043 | 0.078 |
0.025 0.011 | 0.036 |
0.803 0.787 | 0.818 |
0.000 0.000 | 0.000 |
0.000 0.000 | 0.000 |
| 7 spectra, LTYQESR | 0.000 | 0.125 | 0.000 | 0.045 | 0.106 | 0.721 | 0.002 | 0.000 | ||
| 6 spectra, IHLVDK | 0.000 | 0.139 | 0.000 | 0.000 | 0.052 | 0.809 | 0.000 | 0.000 | ||
| 2 spectra, IEPVVLPLLWFEQSGMMGGK | 0.000 | 0.000 | 0.000 | 0.007 | 0.000 | 0.993 | 0.000 | 0.000 | ||
| 2 spectra, EAMQAYSESLMSPAAK | 0.000 | 0.082 | 0.128 | 0.000 | 0.309 | 0.195 | 0.286 | 0.000 | ||
| 5 spectra, GVGQTGK | 0.000 | 0.000 | 0.000 | 0.000 | 0.004 | 0.996 | 0.000 | 0.000 | ||
| 6 spectra, GTVLQEAK | 0.000 | 0.099 | 0.193 | 0.000 | 0.209 | 0.425 | 0.074 | 0.000 | ||
| 6 spectra, IDPSSLSFGMWK | 0.000 | 0.140 | 0.000 | 0.000 | 0.000 | 0.860 | 0.000 | 0.000 | ||
| 2 spectra, MQLSLYIK | 0.000 | 0.065 | 0.000 | 0.000 | 0.000 | 0.935 | 0.000 | 0.000 | ||
| 6 spectra, CFLFWSGSK | 0.000 | 0.000 | 0.038 | 0.418 | 0.000 | 0.533 | 0.002 | 0.009 | ||
| 2 spectra, GPYVYR | 0.000 | 0.174 | 0.000 | 0.087 | 0.000 | 0.739 | 0.000 | 0.000 | ||
| 1 spectrum, VFEGIPTYR | 0.000 | 0.000 | 0.000 | 0.000 | 0.000 | 1.000 | 0.000 | 0.000 | ||
| 1 spectrum, GVANTGK | 0.000 | 0.051 | 0.105 | 0.000 | 0.016 | 0.703 | 0.125 | 0.000 | ||
| 2 spectra, YFPDMFPIK | 0.000 | 0.225 | 0.000 | 0.000 | 0.000 | 0.775 | 0.000 | 0.000 |
| Plot | Mito | Lyso or Perox | ER | Golgi | PM | Cytosol | Nucleus | ||||||
| Expt B |
3 peptides |
7 spectra |
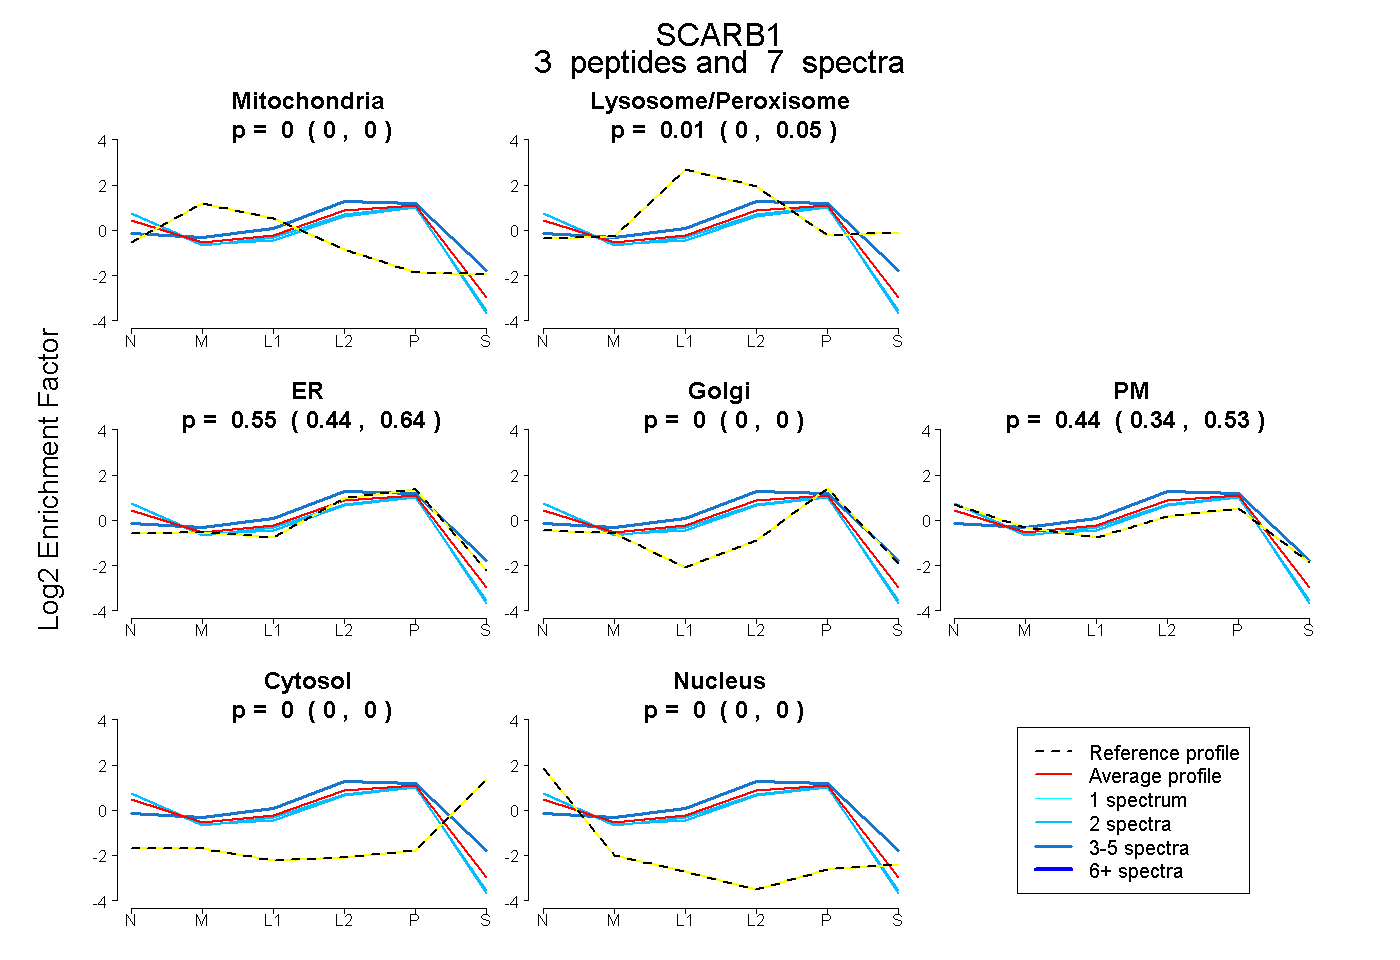 |
0.000 0.000 | 0.000 |
0.007 0.000 | 0.050 |
0.555 0.438 | 0.638 |
0.000 0.000 | 0.000 |
0.439 0.335 | 0.527 |
0.000 0.000 | 0.000 |
0.000 0.000 | 0.000 |
|||
| Plot | Lyso | Other | |||||||||||
| Expt C |
11 peptides |
120 spectra |
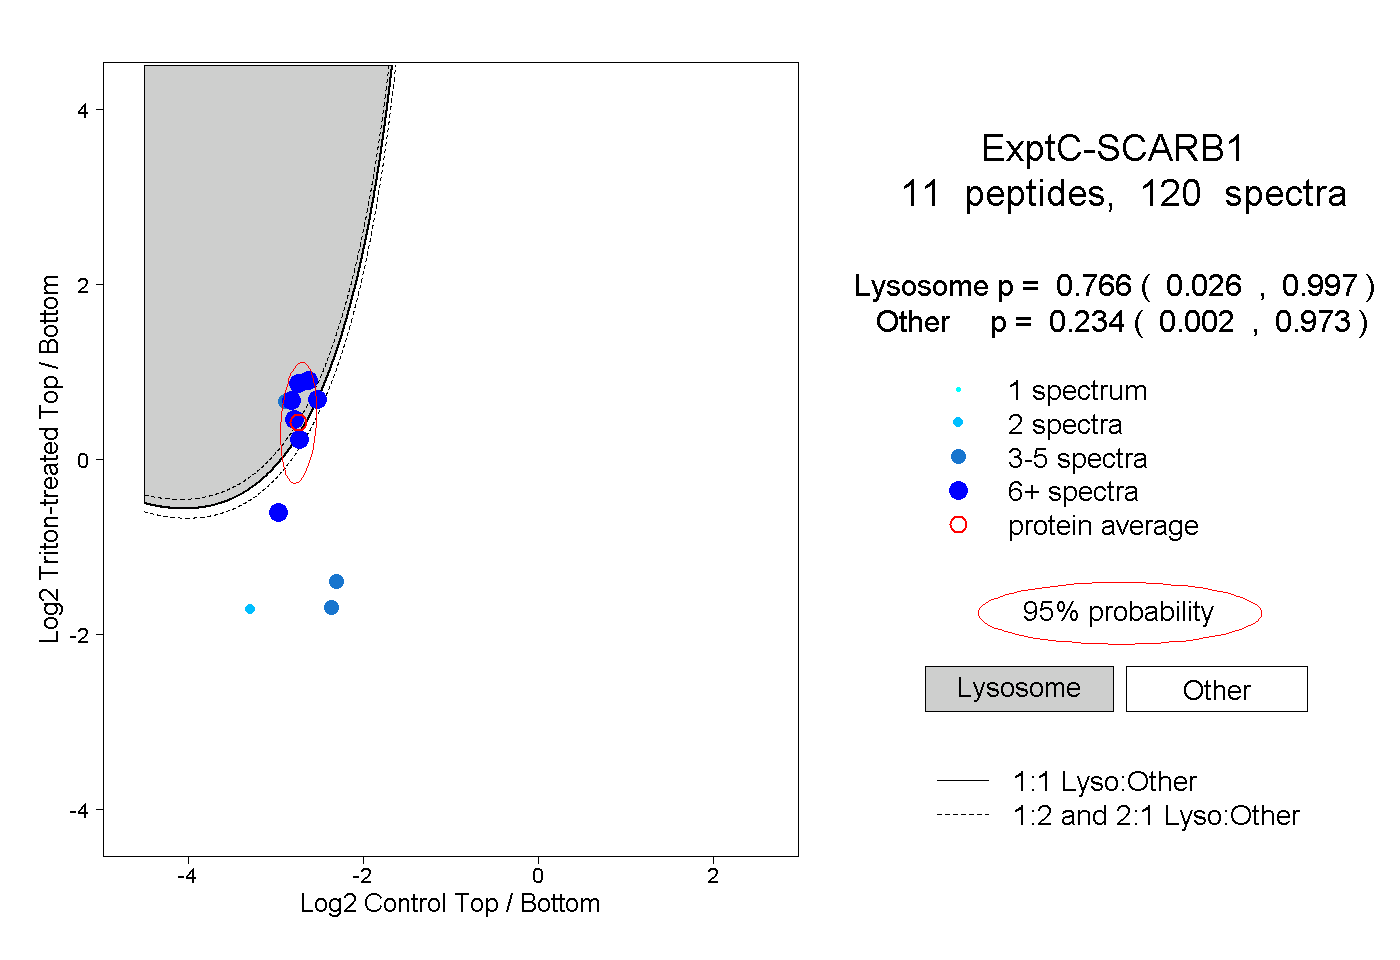 |
0.766 0.026 | 0.997 |
0.234 0.002 | 0.973 |
||||||||
| Plot | Lyso | Other | |||||||||||
| Expt D |
4 peptides |
5 spectra |
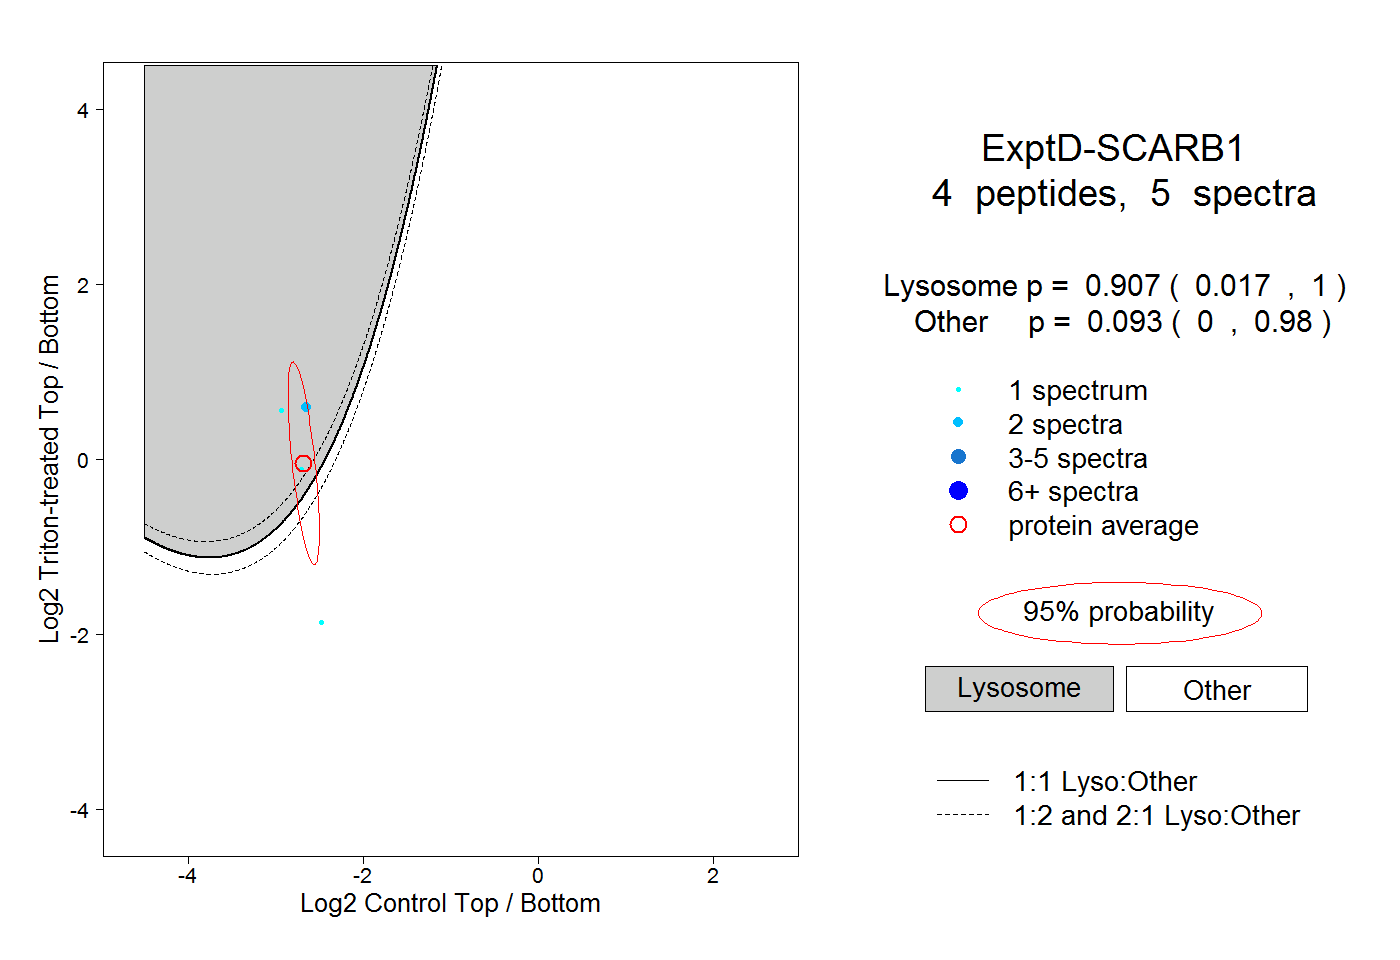 |
0.907 0.017 | 1.000 |
0.093 0.000 | 0.980 |