 12
12peptides
spectra
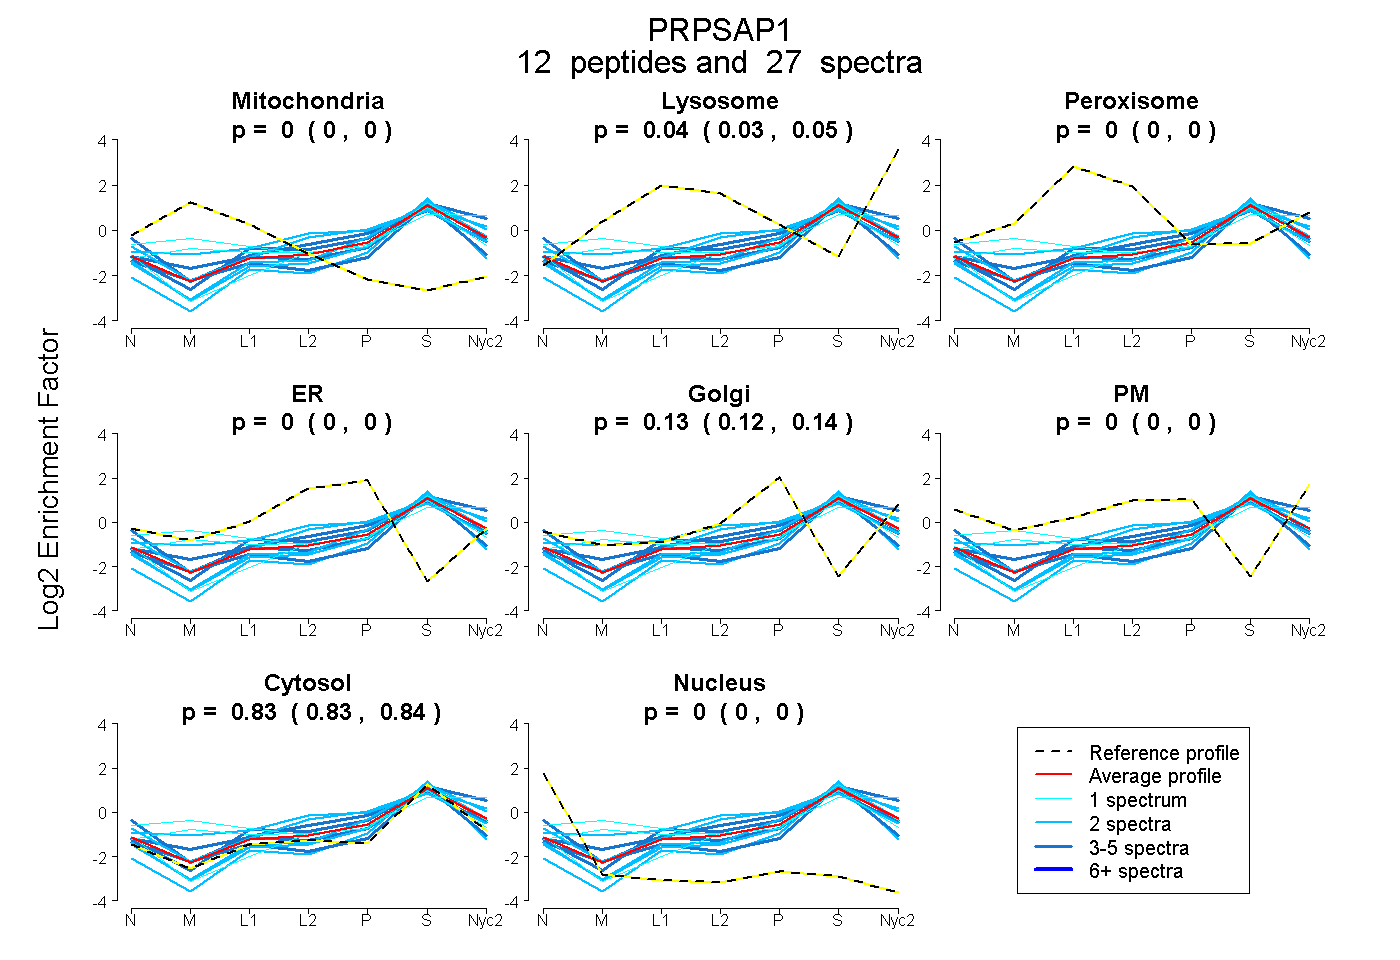
0.000 | 0.000
0.028 | 0.047
0.000 | 0.000
0.000 | 0.000
0.120 | 0.137
0.000 | 0.000
0.825 | 0.839
0.000 | 0.000
1peptide
spectrum
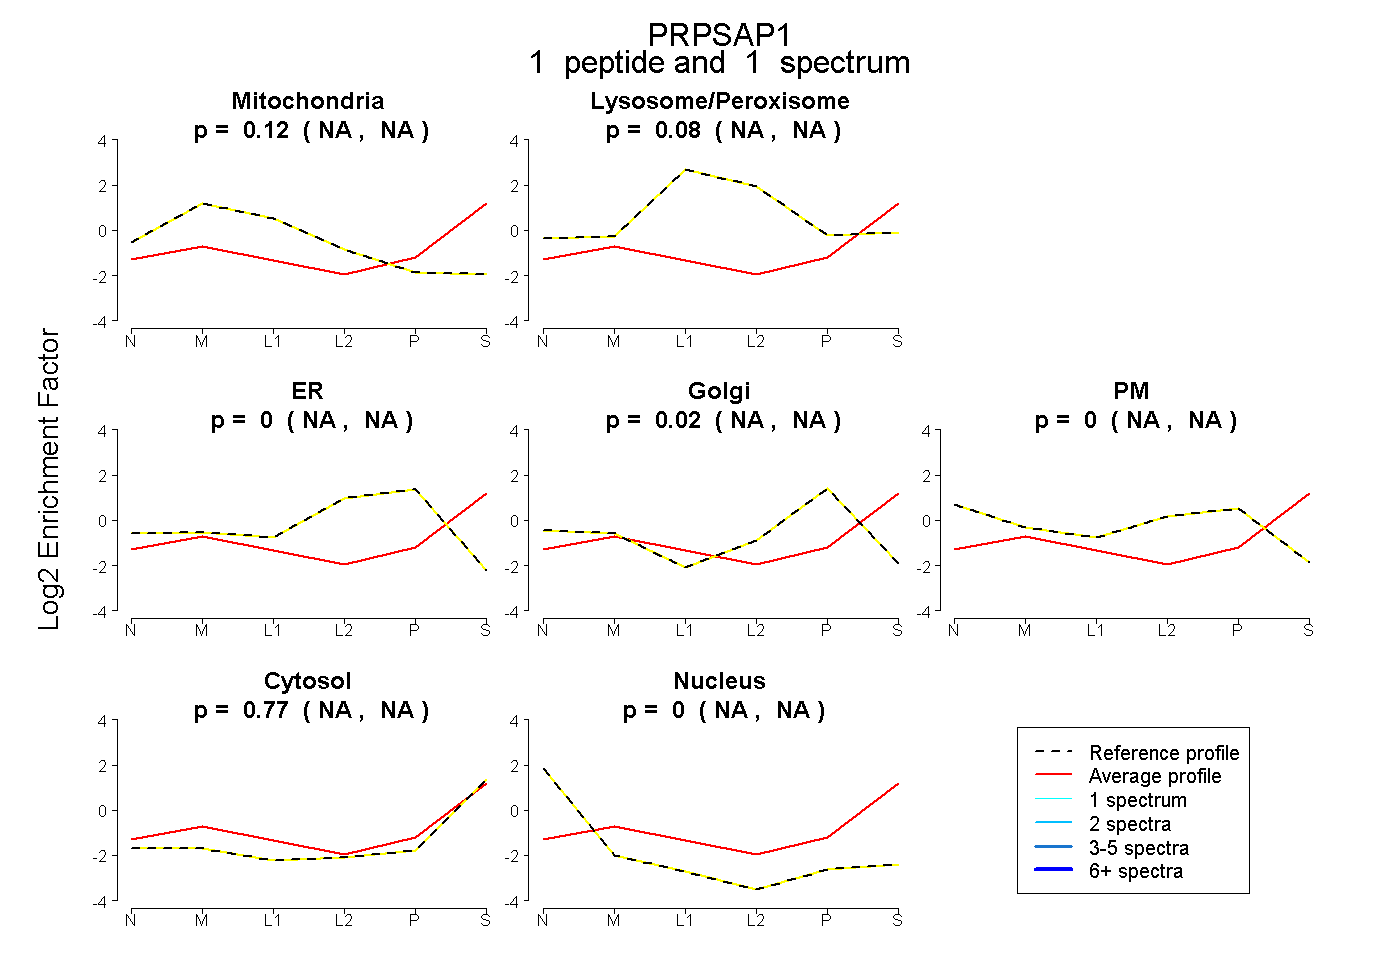
NA | NA
NA | NA
NA | NA
NA | NA
NA | NA
NA | NA
NA | NA
6peptides
spectra
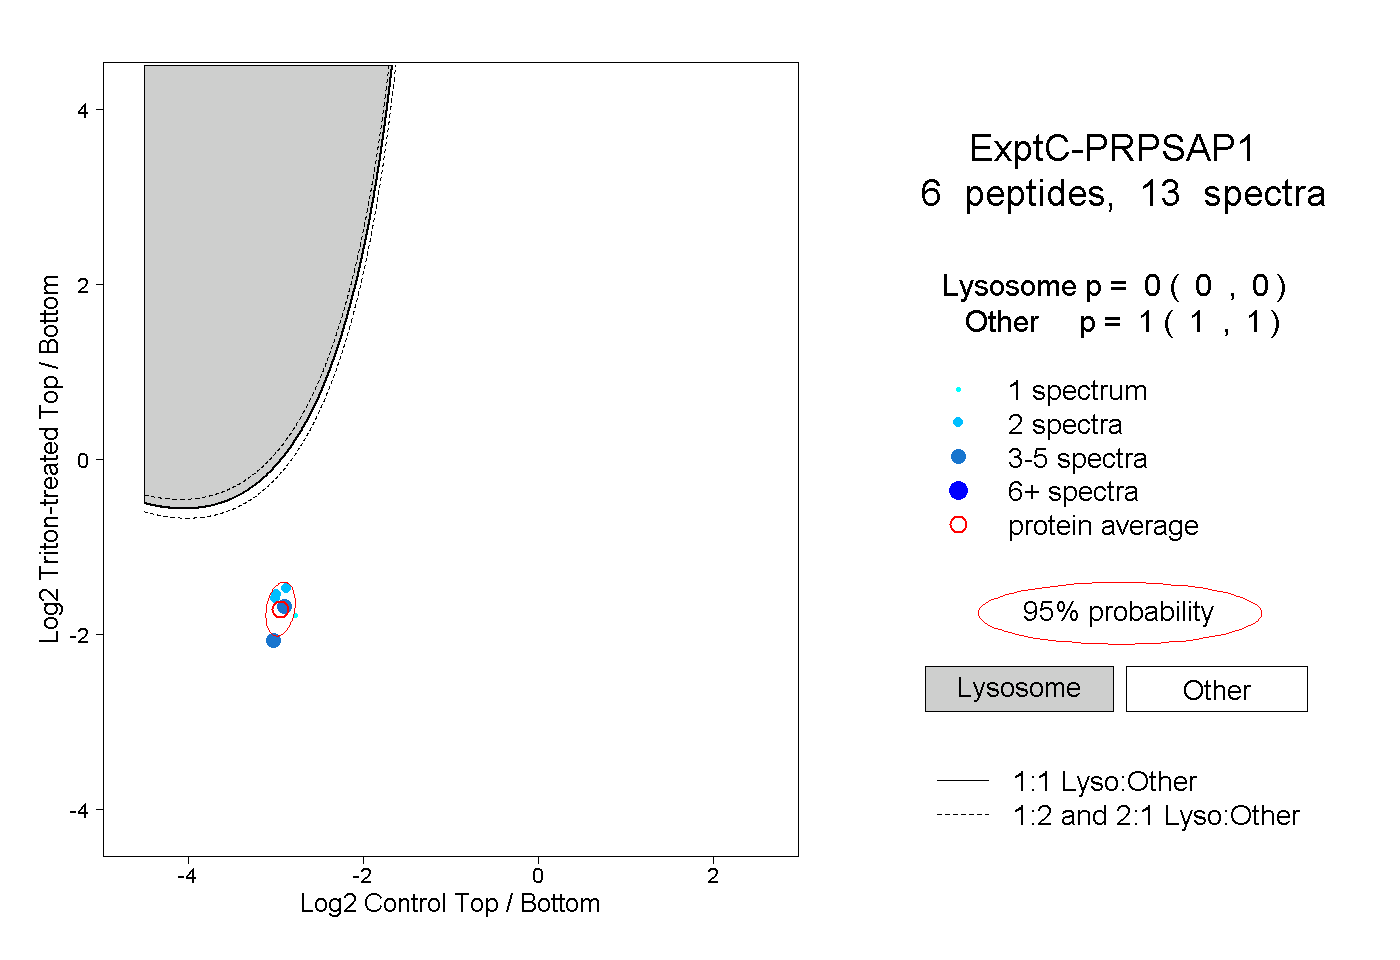
0.000 | 0.000
1.000 | 1.000
1peptide
spectrum
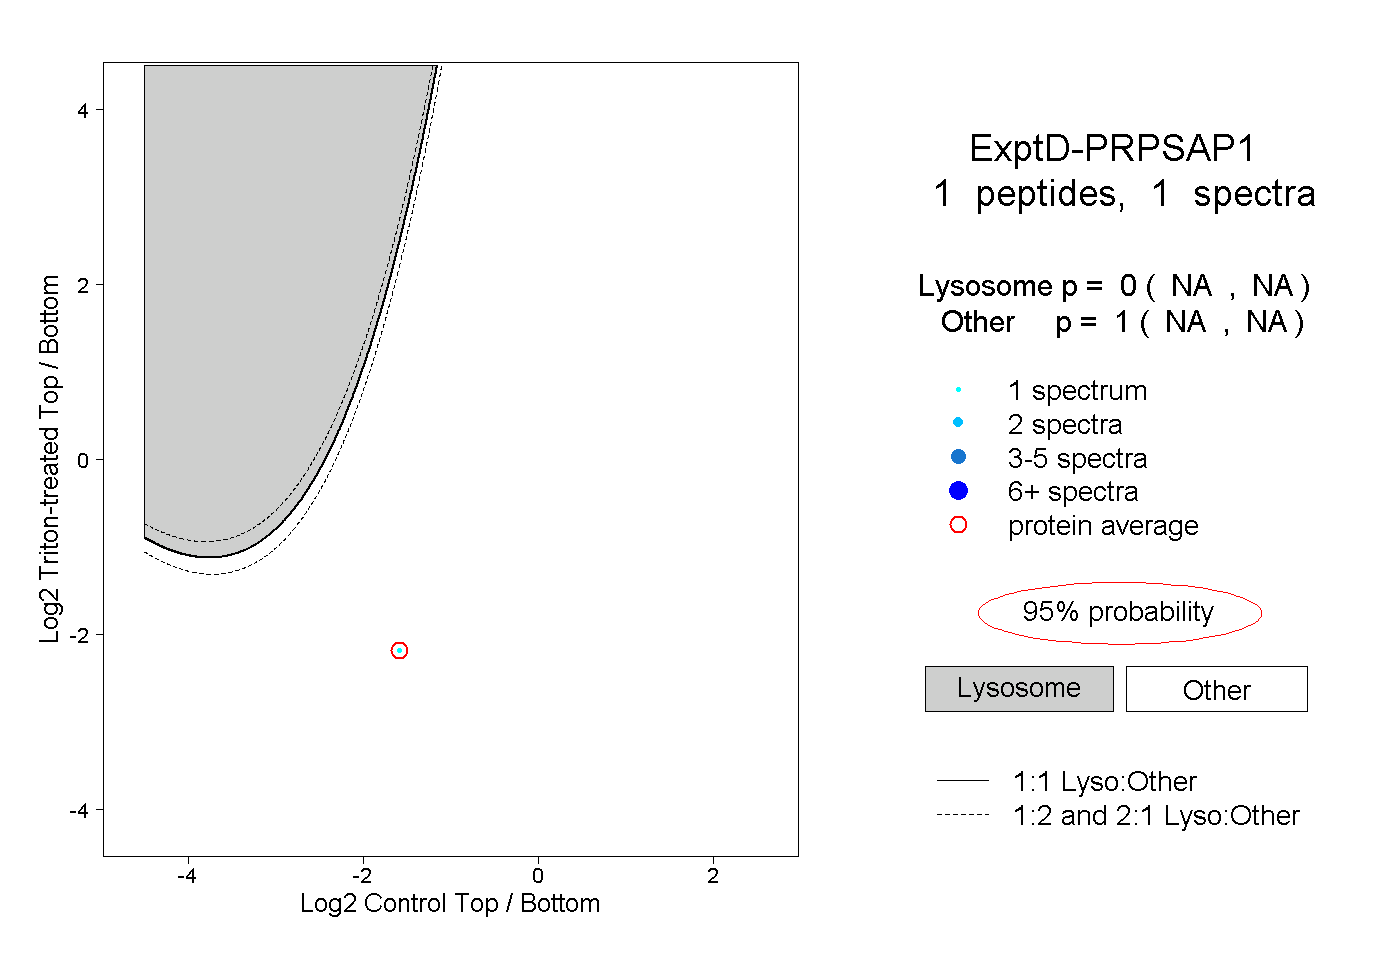
NA | NA
NA | NA