 12
12peptides
spectra
0.000 | 0.000
0.028 | 0.047
0.000 | 0.000
0.000 | 0.000
0.120 | 0.137
0.000 | 0.000
0.825 | 0.839
0.000 | 0.000
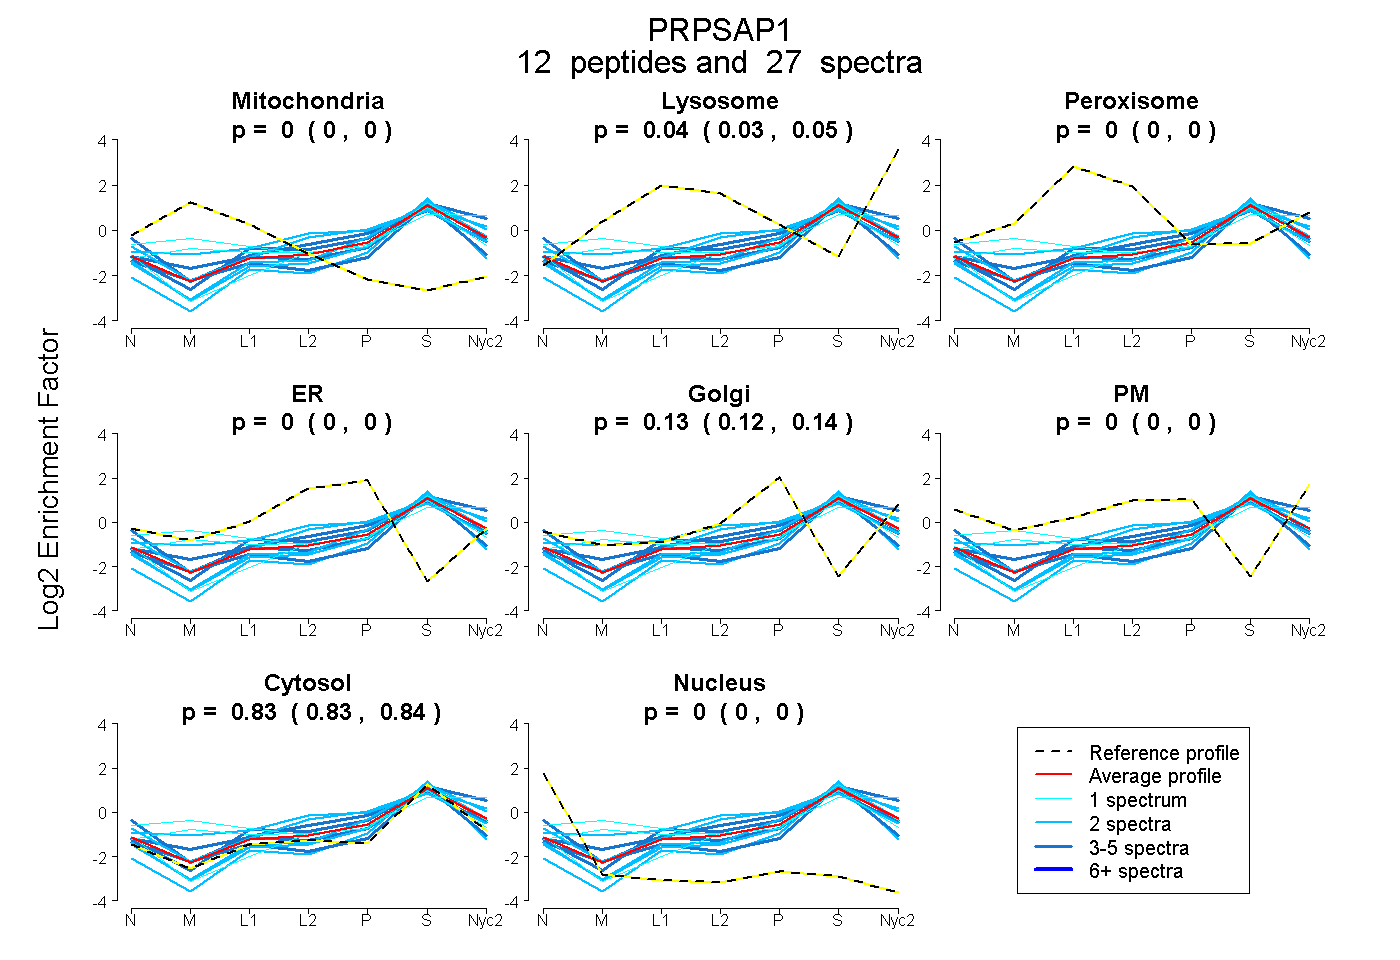
| Plot | Mito | Lyso | Perox | ER | Golgi | PM | Cytosol | Nucleus | |||||
| Expt A |
12 peptides |
27 spectra |
|
0.000 0.000 | 0.000 |
0.039 0.028 | 0.047 |
0.000 0.000 | 0.000 |
0.000 0.000 | 0.000 |
0.129 0.120 | 0.137 |
0.000 0.000 | 0.000 |
0.833 0.825 | 0.839 |
0.000 0.000 | 0.000 |
| 1 spectrum, TVDISLILSEAIR | 0.000 | 0.000 | 0.000 | 0.000 | 0.081 | 0.000 | 0.919 | 0.000 | ||
| 1 spectrum, NIIGVIPYFPYSK | 0.137 | 0.081 | 0.037 | 0.000 | 0.033 | 0.000 | 0.712 | 0.000 | ||
| 3 spectra, ARPAASPAMNAAR | 0.000 | 0.000 | 0.000 | 0.098 | 0.031 | 0.122 | 0.749 | 0.000 | ||
| 2 spectra, SVVYQETNGETR | 0.000 | 0.000 | 0.000 | 0.000 | 0.079 | 0.000 | 0.921 | 0.000 | ||
| 4 spectra, AQSYAER | 0.000 | 0.168 | 0.000 | 0.000 | 0.052 | 0.000 | 0.780 | 0.000 | ||
| 2 spectra, NAVIVAK | 0.000 | 0.048 | 0.000 | 0.000 | 0.141 | 0.109 | 0.701 | 0.000 | ||
| 2 spectra, AGLTHLITMDLHQK | 0.000 | 0.000 | 0.000 | 0.000 | 0.000 | 0.000 | 1.000 | 0.000 | ||
| 3 spectra, EKPPITVVGDVGGR | 0.075 | 0.000 | 0.019 | 0.000 | 0.071 | 0.000 | 0.835 | 0.000 | ||
| 4 spectra, GQDIFIIQTIPR | 0.000 | 0.018 | 0.000 | 0.000 | 0.031 | 0.000 | 0.951 | 0.000 | ||
| 2 spectra, IYVMATHGILSAEAPR | 0.000 | 0.000 | 0.159 | 0.145 | 0.074 | 0.000 | 0.622 | 0.000 | ||
| 2 spectra, LLASMLAK | 0.000 | 0.000 | 0.000 | 0.000 | 0.113 | 0.000 | 0.887 | 0.000 | ||
| 1 spectrum, VFSANSTAACTELAK | 0.099 | 0.220 | 0.000 | 0.000 | 0.000 | 0.097 | 0.583 | 0.000 |
| Plot | Mito | Lyso or Perox | ER | Golgi | PM | Cytosol | Nucleus | ||||||
| Expt B |
1 peptide |
1 spectrum |
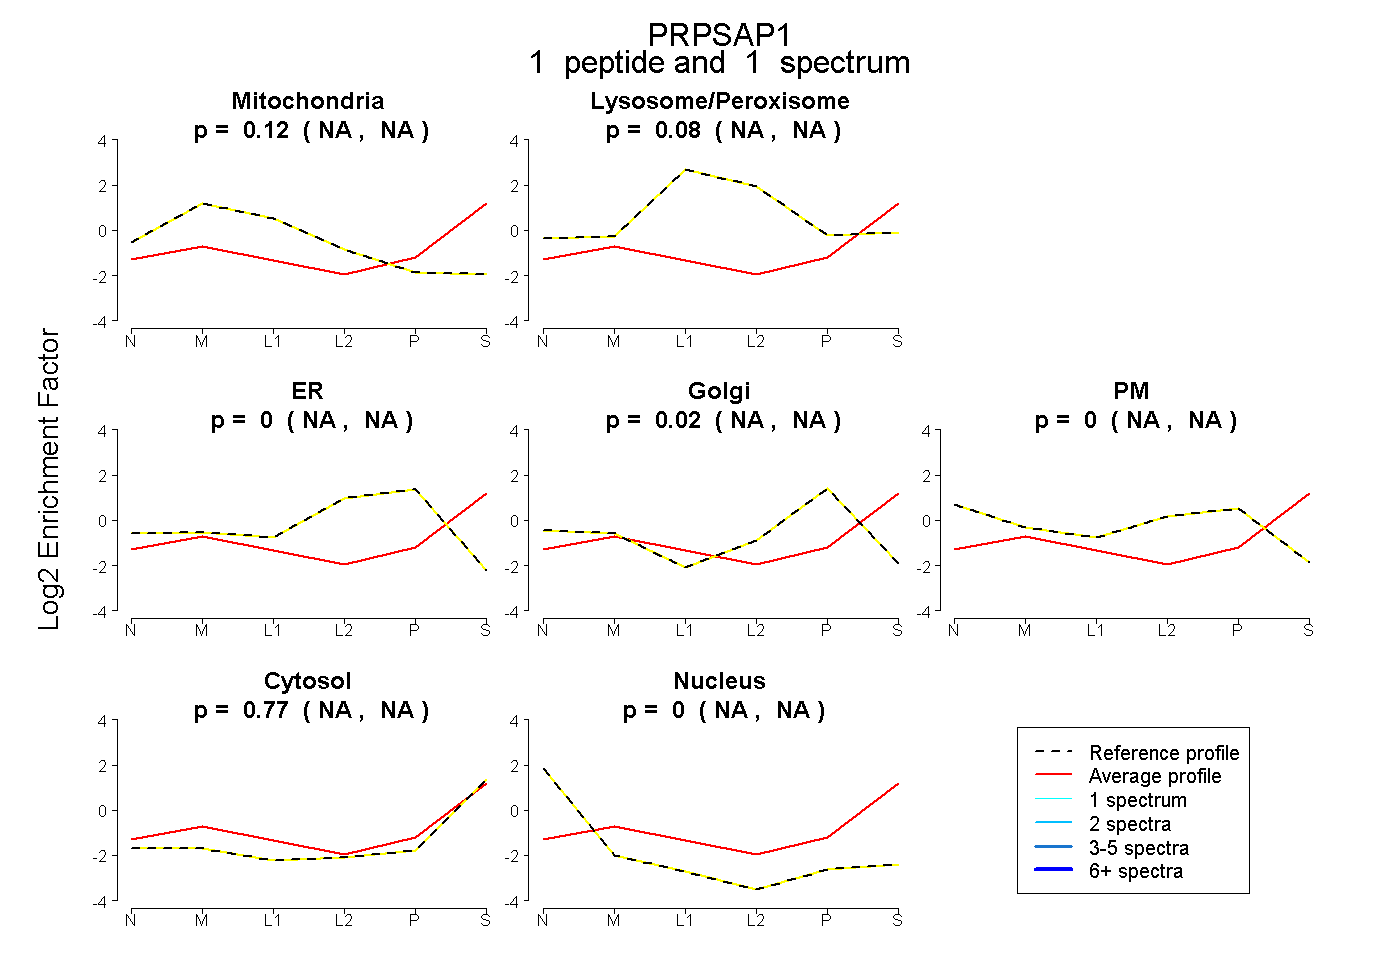 |
0.124 NA | NA |
0.081 NA | NA |
0.000 NA | NA |
0.023 NA | NA |
0.000 NA | NA |
0.772 NA | NA |
0.000 NA | NA |
|||
| Plot | Lyso | Other | |||||||||||
| Expt C |
6 peptides |
13 spectra |
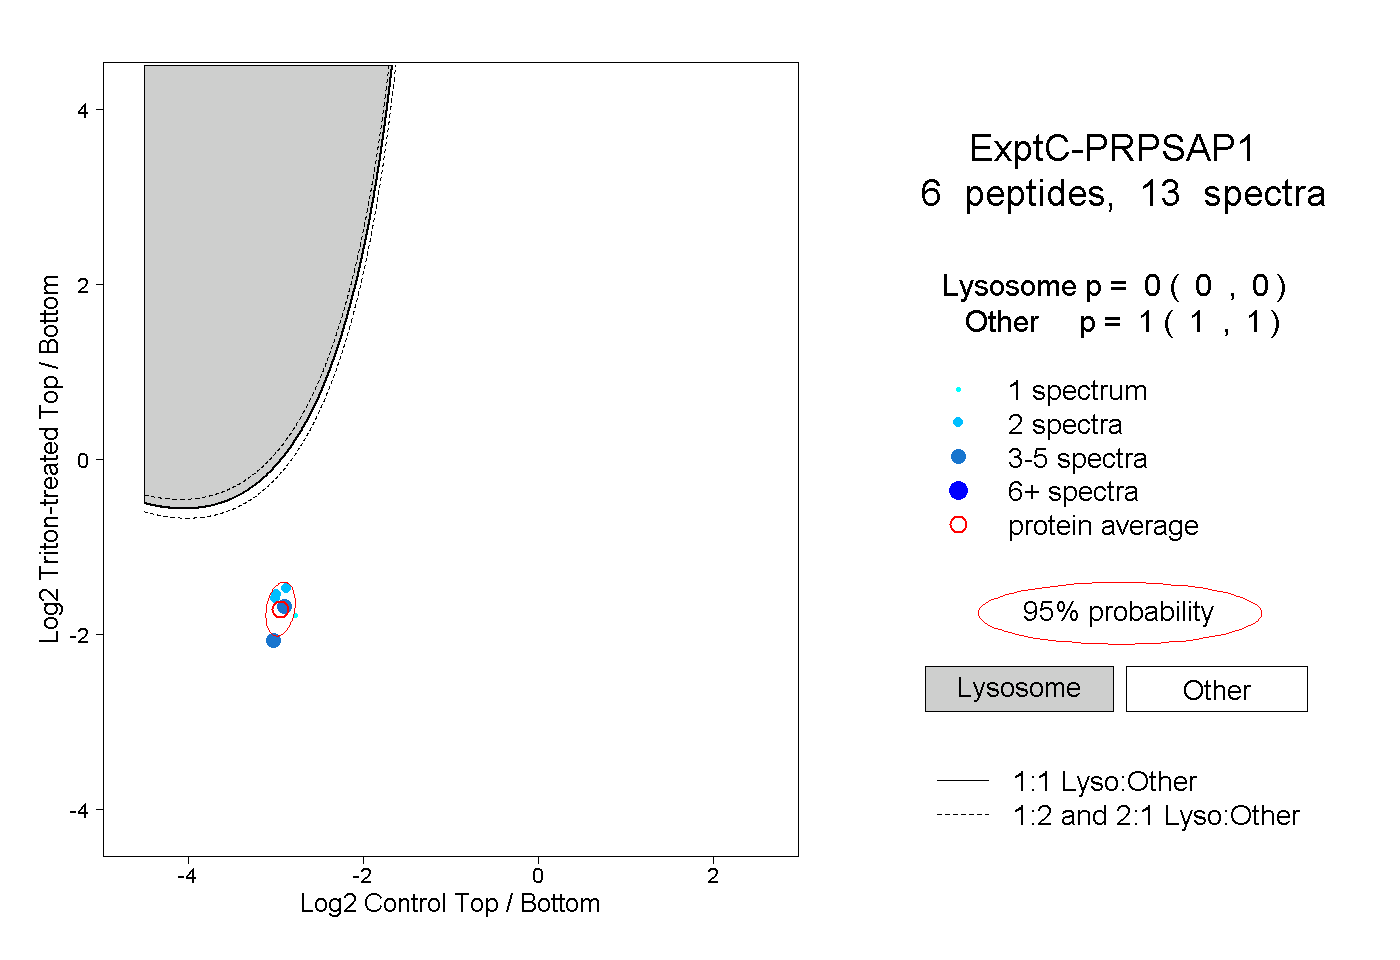 |
0.000 0.000 | 0.000 |
1.000 1.000 | 1.000 |
||||||||
| Plot | Lyso | Other | |||||||||||
| Expt D |
1 peptide |
1 spectrum |
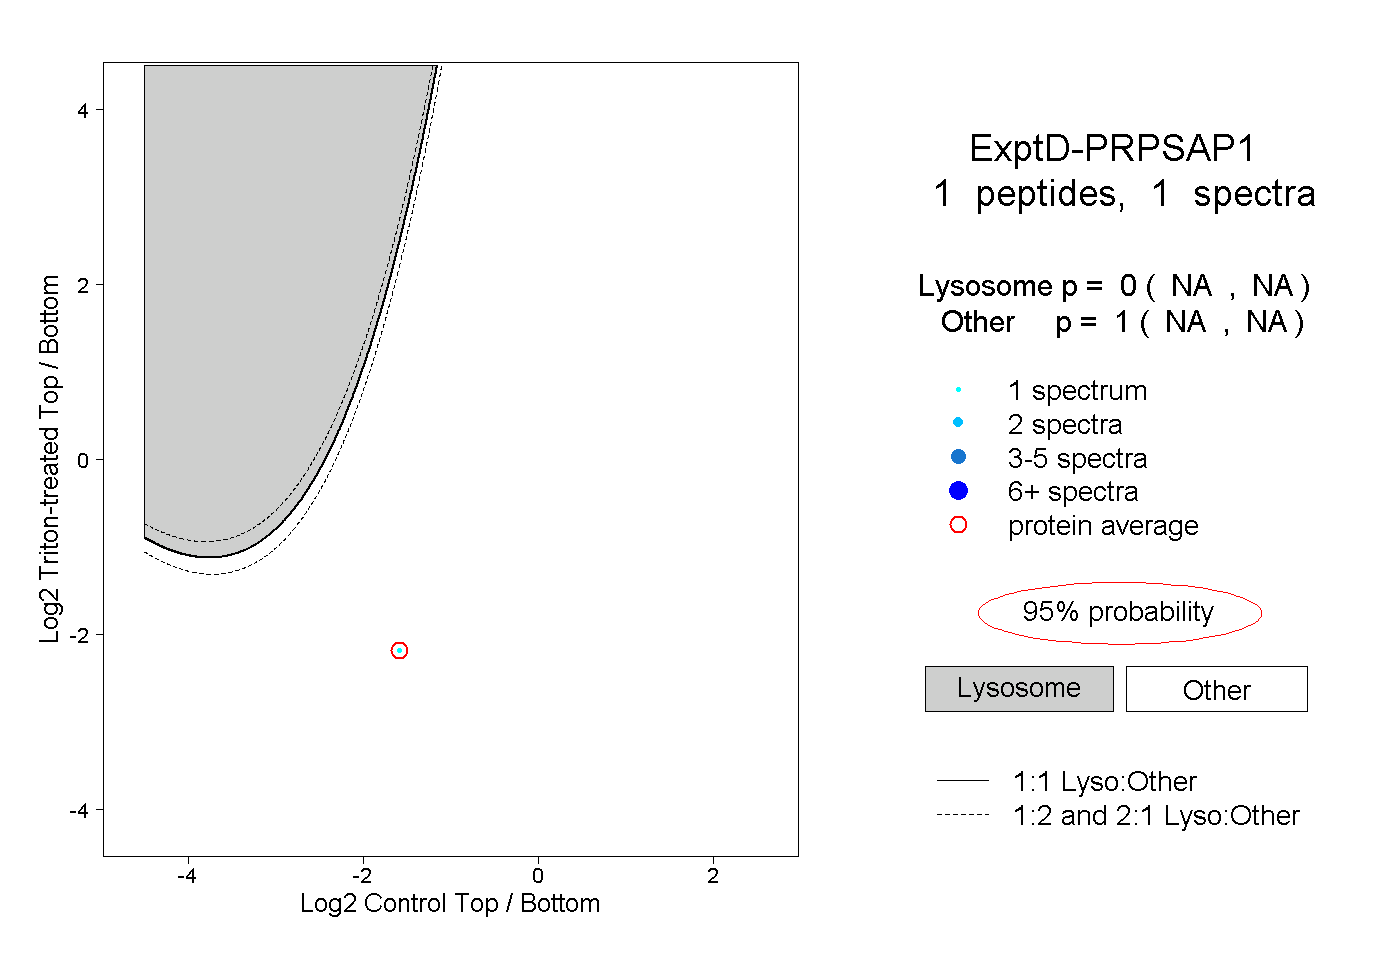 |
0.000 NA | NA |
1.000 NA | NA |