 21
21peptides
spectra
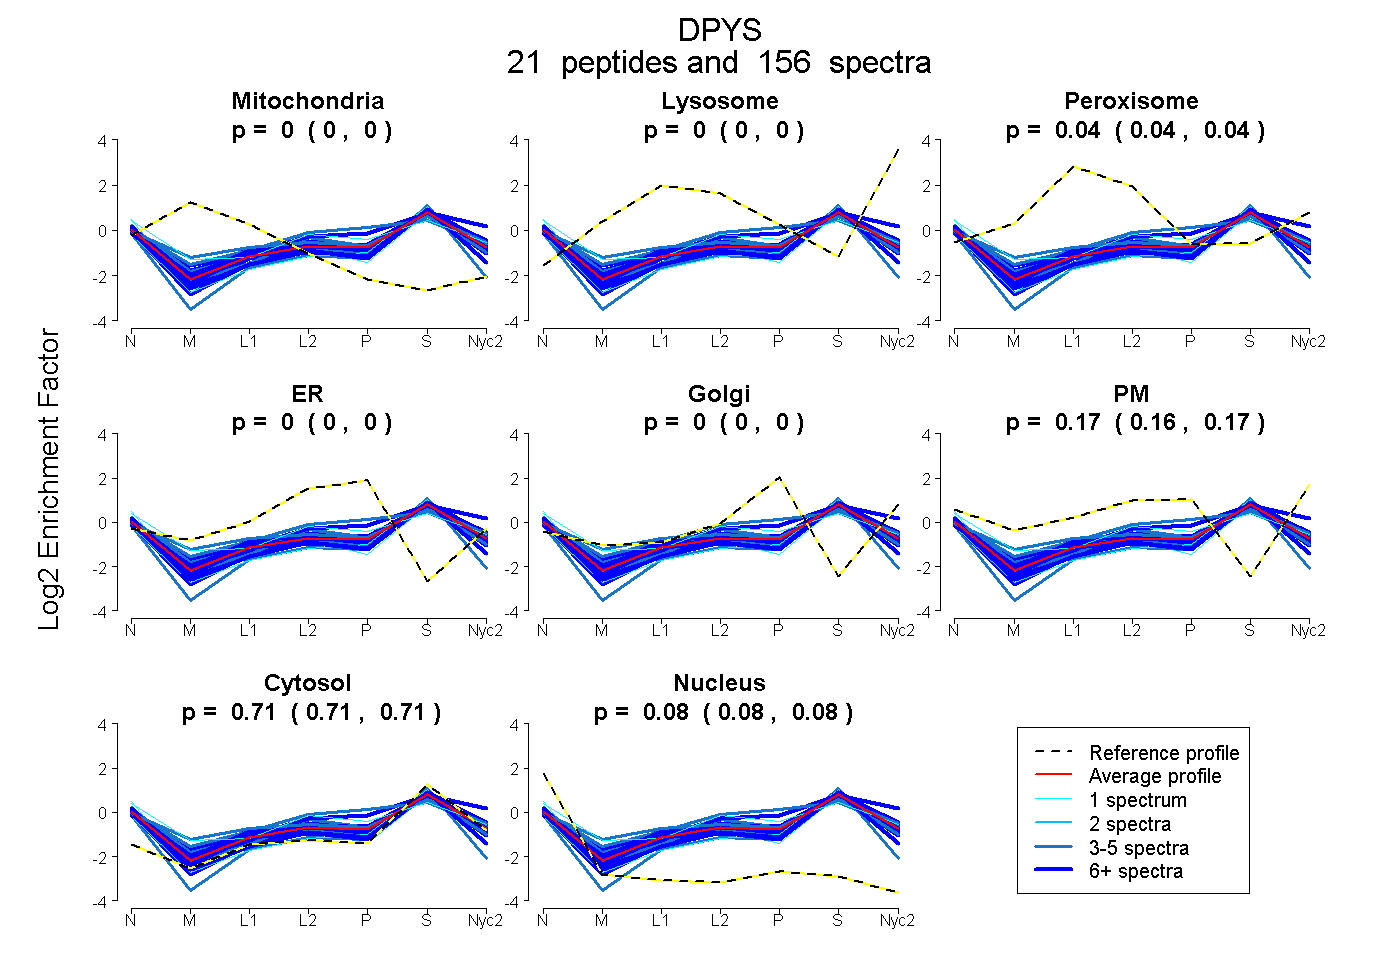
0.000 | 0.000
0.000 | 0.000
0.038 | 0.043
0.000 | 0.000
0.000 | 0.000
0.164 | 0.171
0.706 | 0.710
0.081 | 0.085
12peptides
spectra
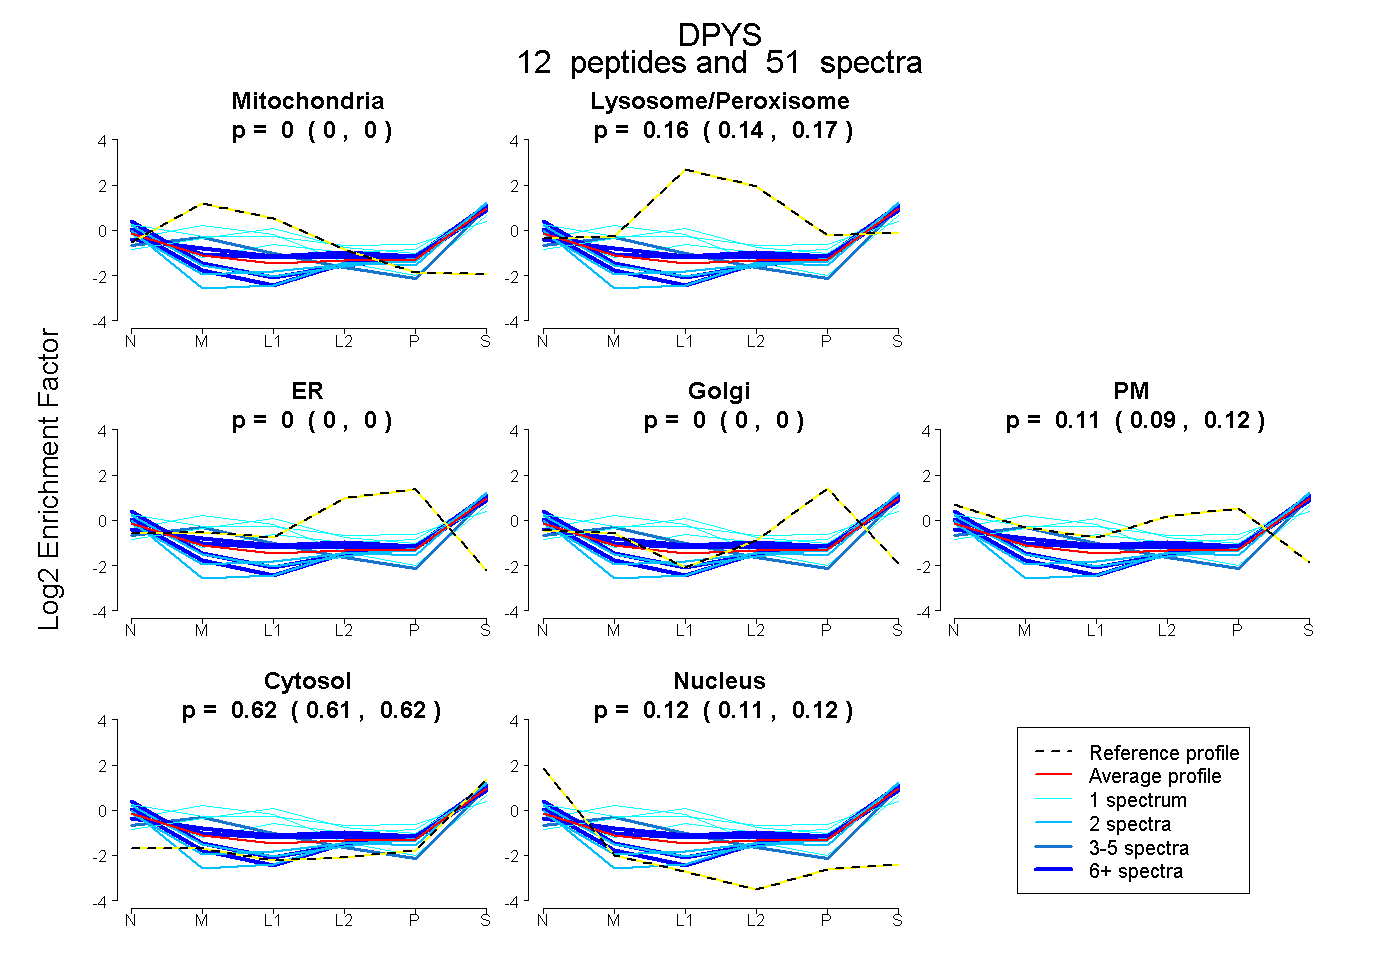
0.000 | 0.000
0.144 | 0.171
0.000 | 0.000
0.000 | 0.000
0.092 | 0.124
0.608 | 0.622
0.106 | 0.124
20peptides
spectra
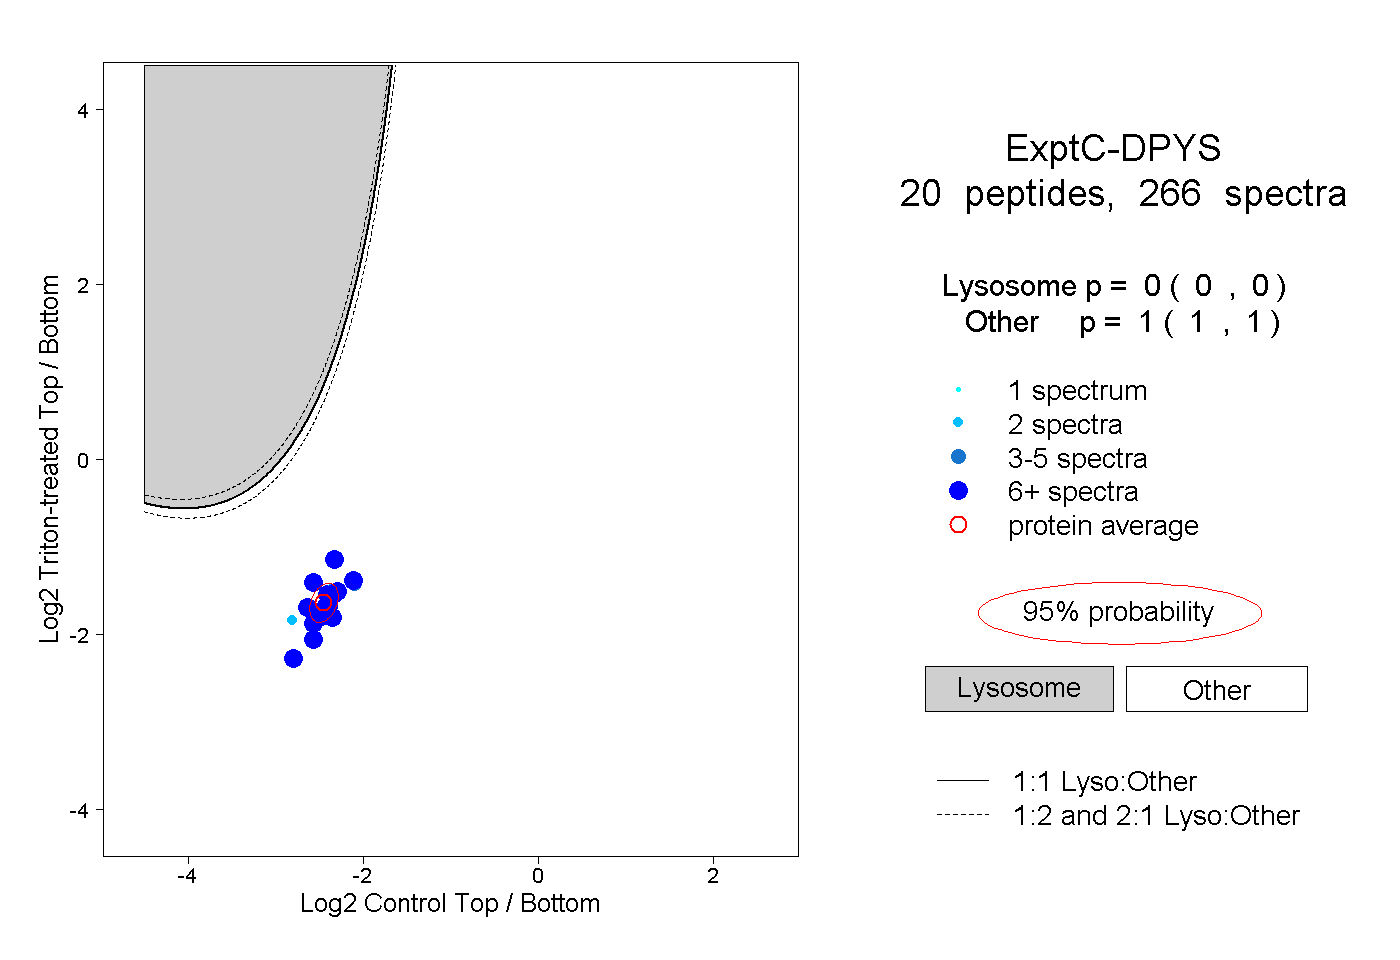
0.000 | 0.000
1.000 | 1.000
11peptides
spectra
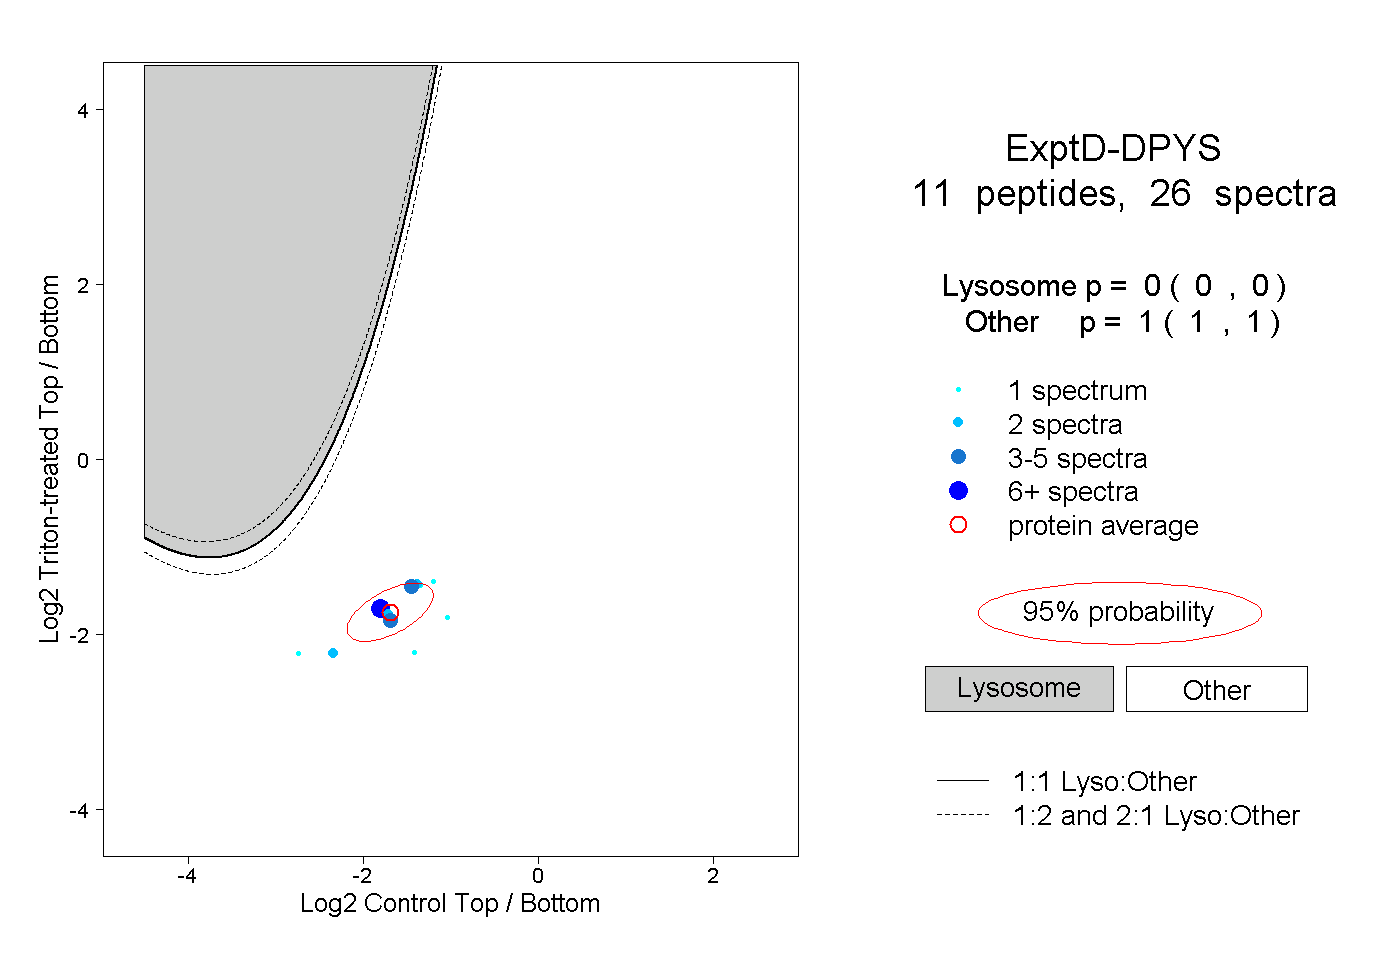
0.000 | 0.000
1.000 | 1.000