 5
5peptides
spectra
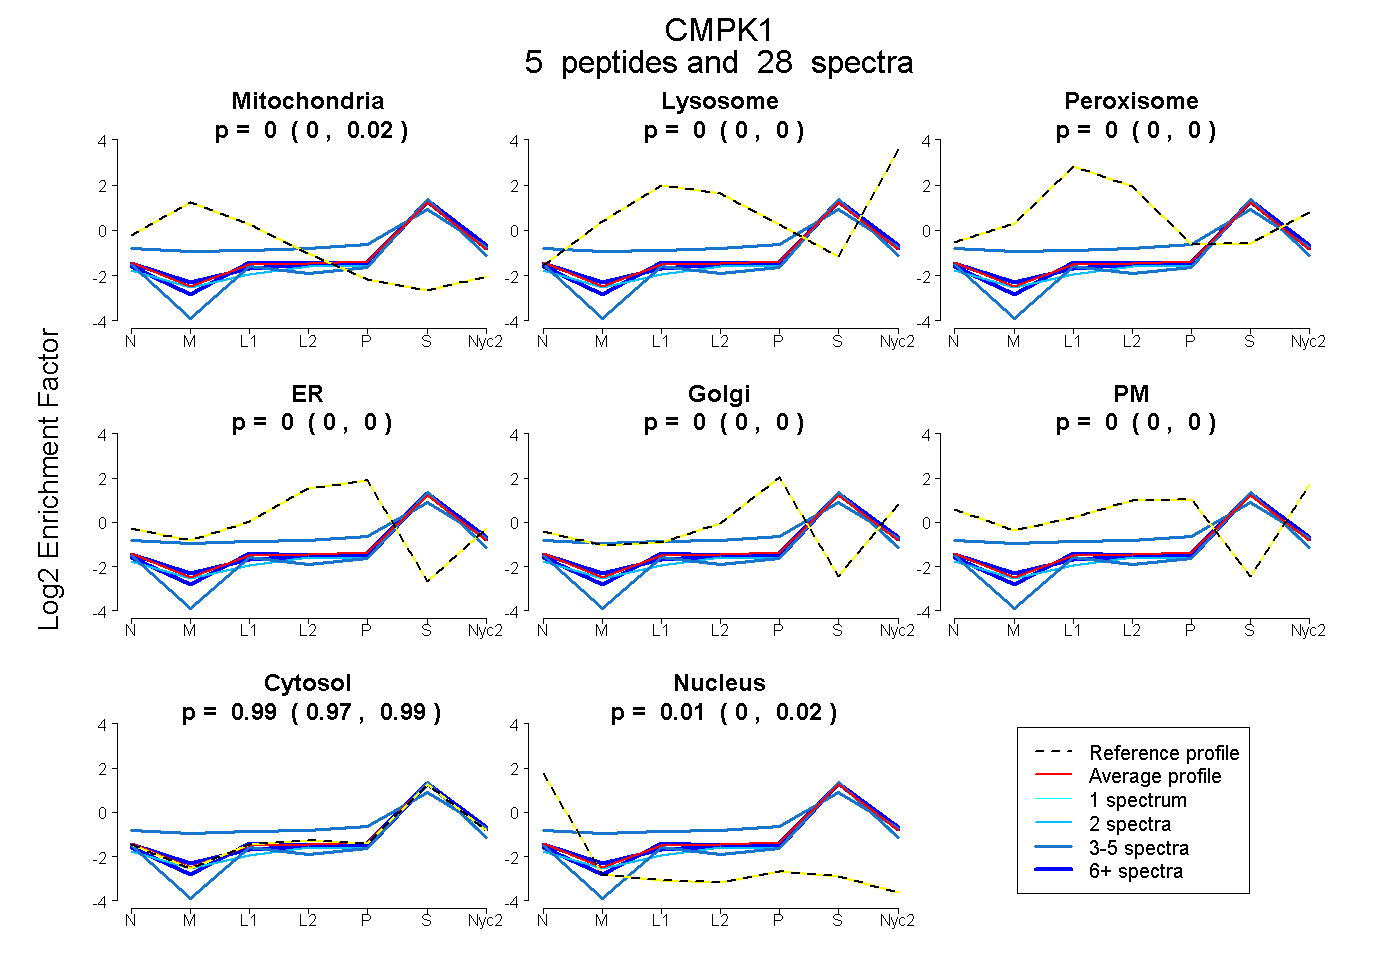
0.000 | 0.019
0.000 | 0.000
0.000 | 0.000
0.000 | 0.000
0.000 | 0.004
0.000 | 0.000
0.975 | 0.993
0.000 | 0.016
4peptides
spectra
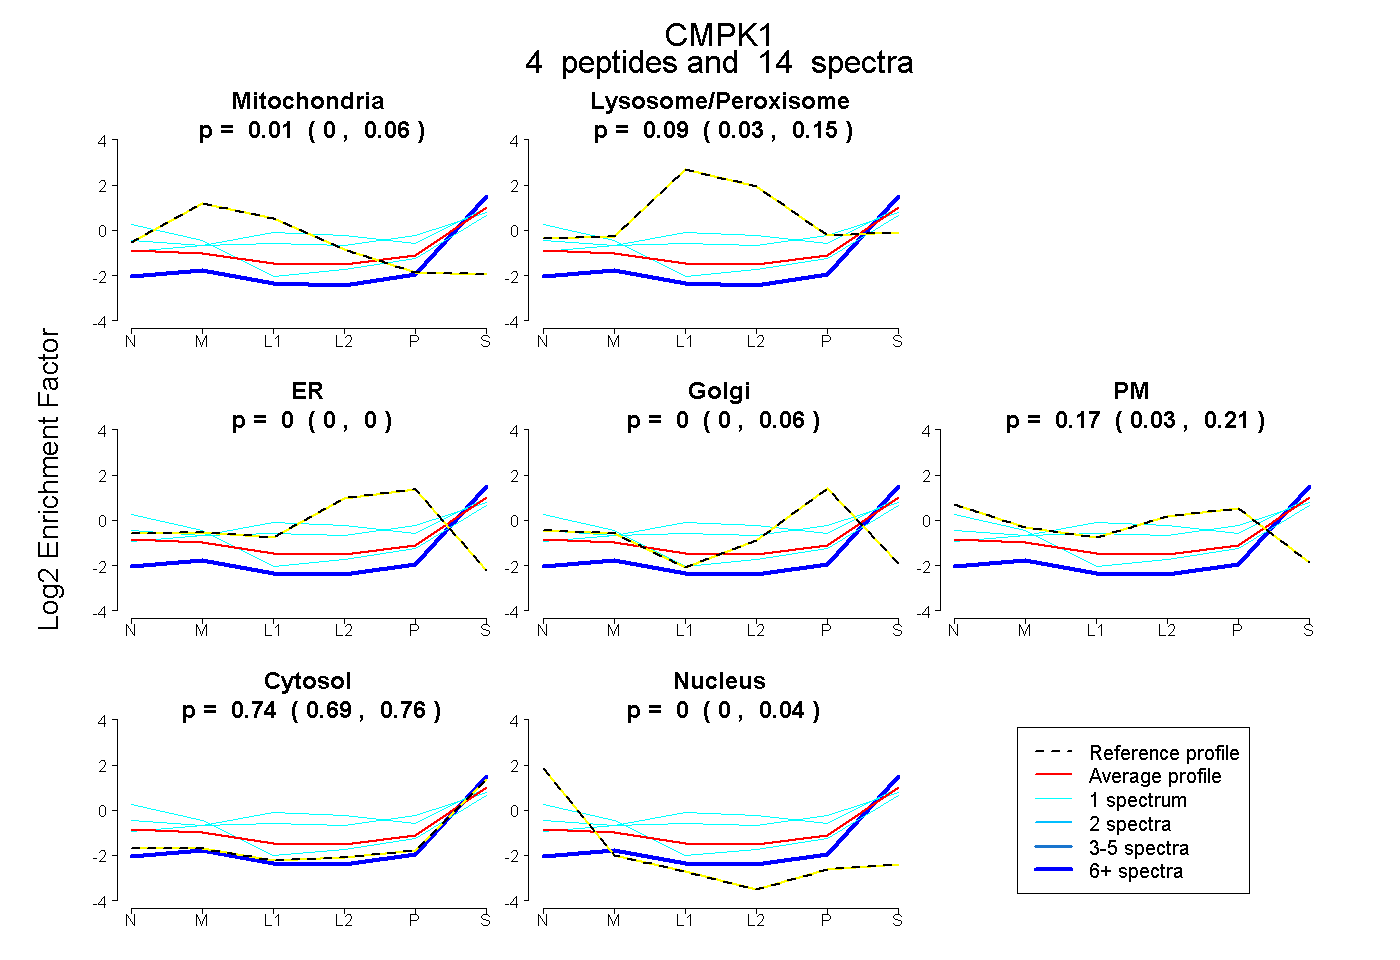
0.000 | 0.063
0.031 | 0.154
0.000 | 0.000
0.000 | 0.061
0.031 | 0.214
0.685 | 0.764
0.000 | 0.044
6peptides
spectra
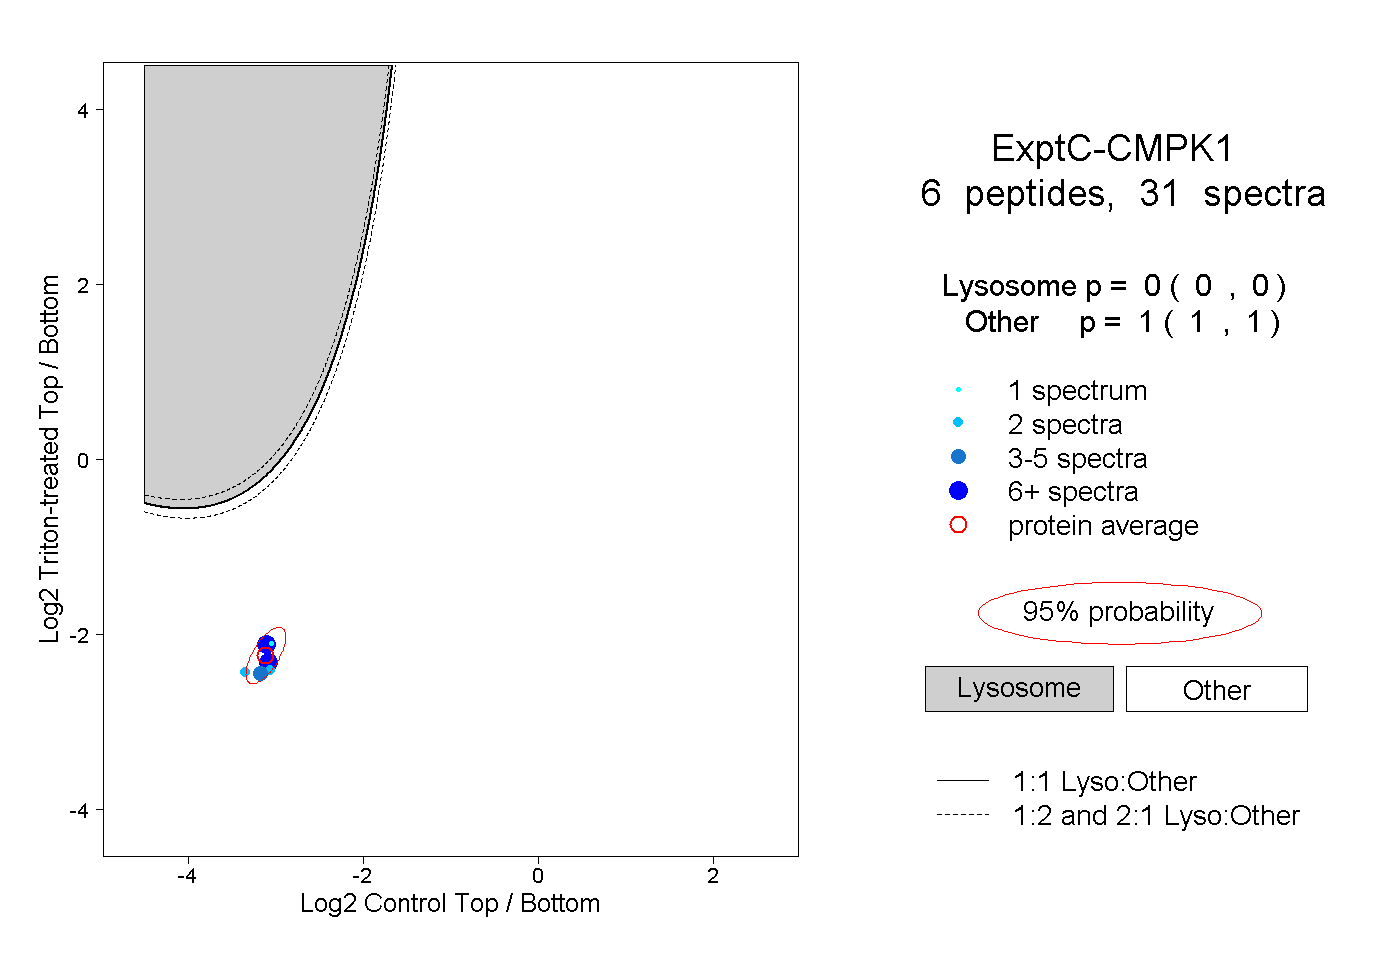
0.000 | 0.000
1.000 | 1.000
1peptide
spectra
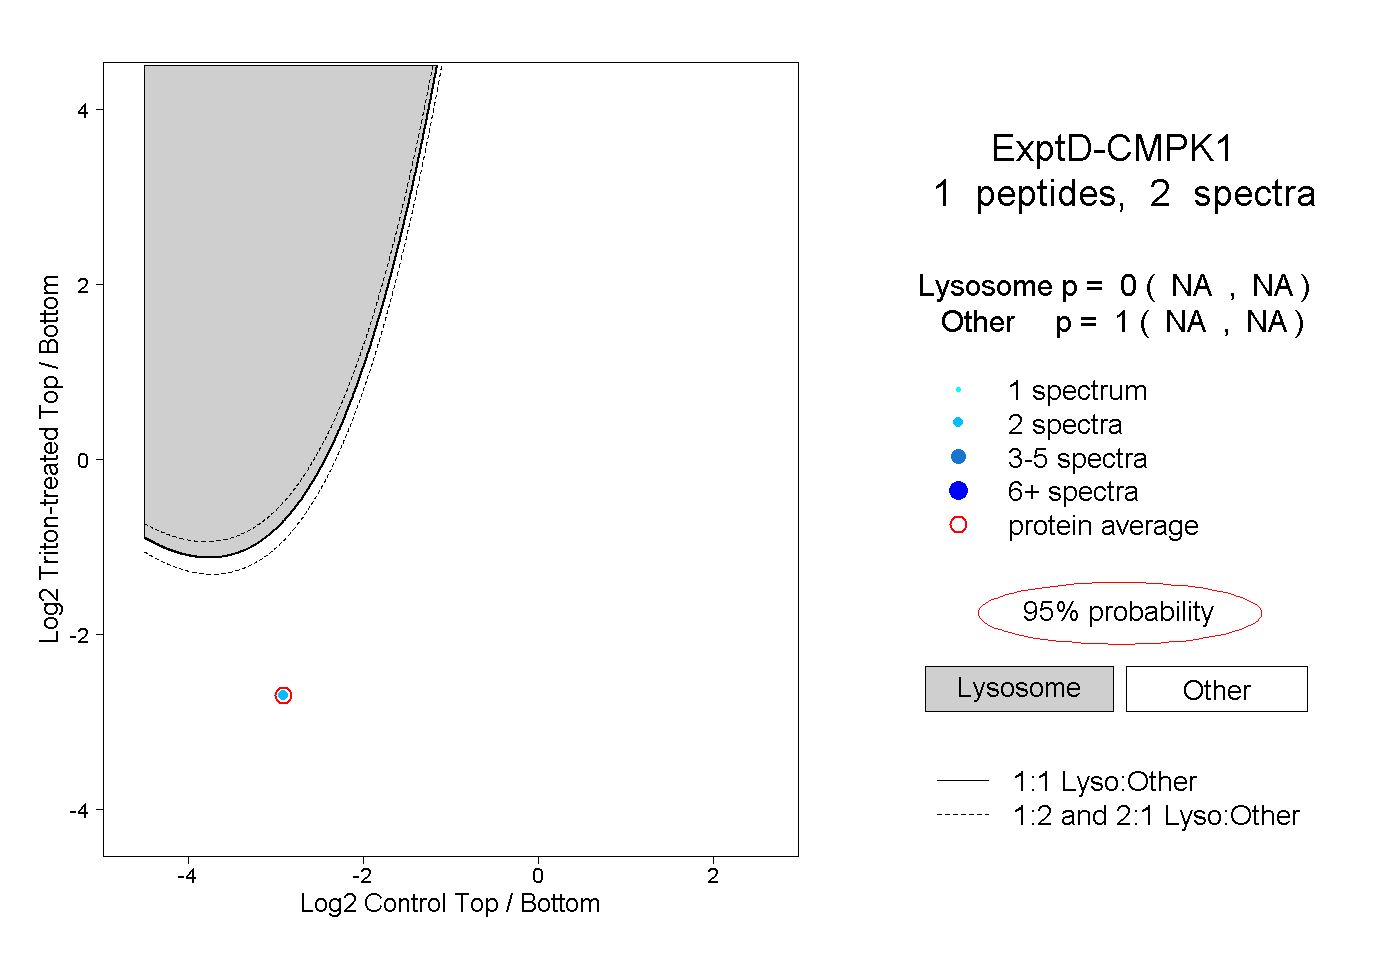
NA | NA
NA | NA