 5
5peptides
spectra
0.000 | 0.019
0.000 | 0.000
0.000 | 0.000
0.000 | 0.000
0.000 | 0.004
0.000 | 0.000
0.975 | 0.993
0.000 | 0.016
| Plot | Mito | Lyso | Perox | ER | Golgi | PM | Cytosol | Nucleus | |||||
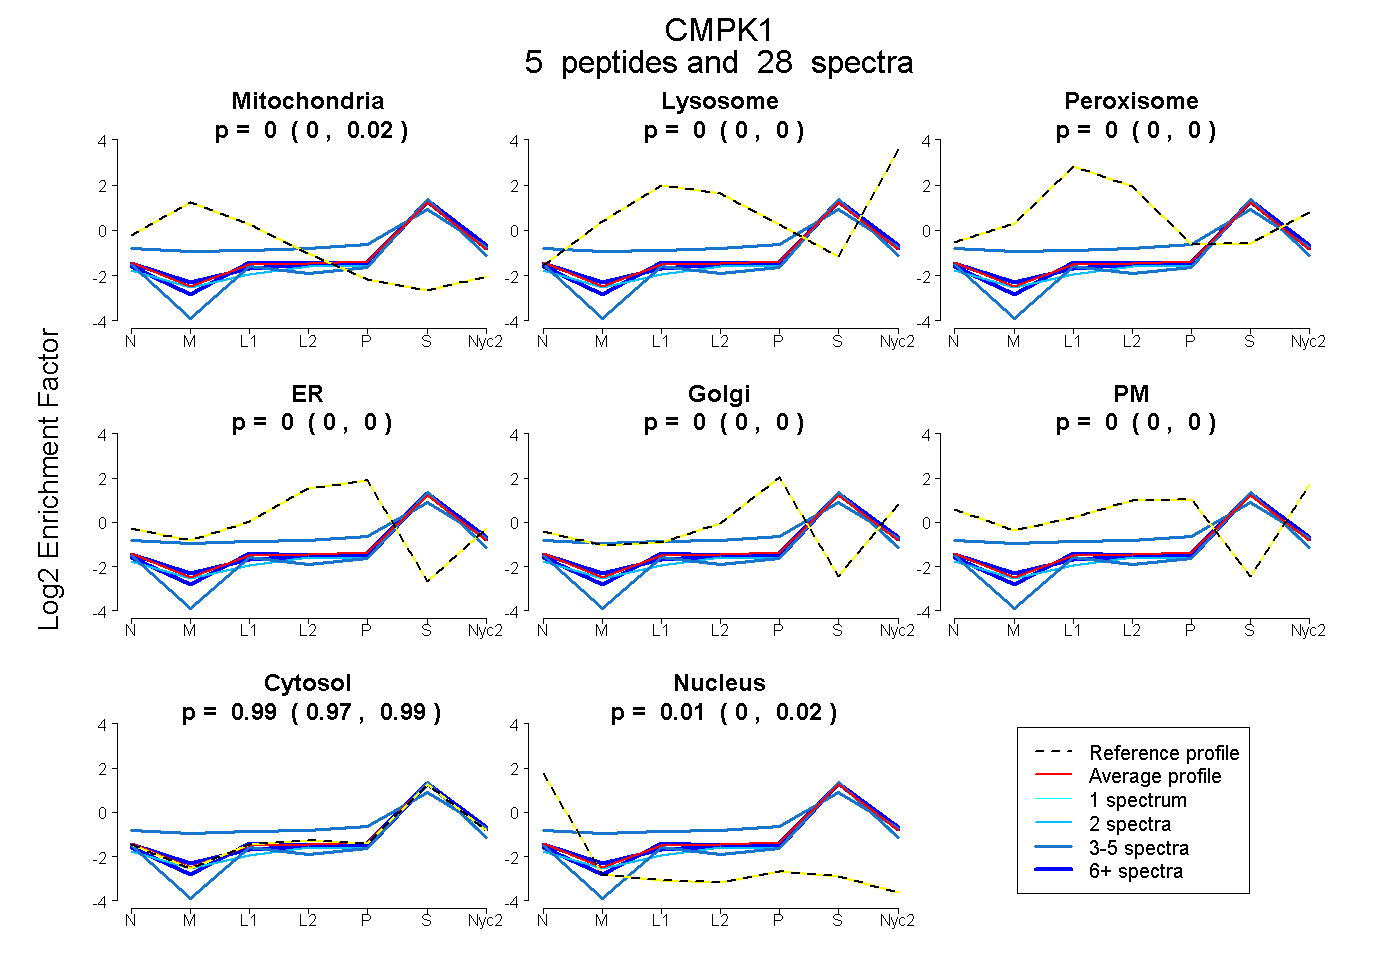
| Expt A |
5 peptides |
28 spectra |
|
0.000 0.000 | 0.019 |
0.000 0.000 | 0.000 |
0.000 0.000 | 0.000 |
0.000 0.000 | 0.000 |
0.000 0.000 | 0.004 |
0.000 0.000 | 0.000 |
0.989 0.975 | 0.993 |
0.011 0.000 | 0.016 |
| 2 spectra, IVPVEITISLLK | 0.000 | 0.000 | 0.000 | 0.000 | 0.000 | 0.000 | 0.974 | 0.026 | ||
| 8 spectra, EMDQTMAANAQK | 0.000 | 0.000 | 0.000 | 0.000 | 0.000 | 0.000 | 1.000 | 0.000 | ||
| 4 spectra, YGYTHLSAGELLR | 0.102 | 0.000 | 0.129 | 0.000 | 0.091 | 0.000 | 0.678 | 0.000 | ||
| 3 spectra, SVDEVFGDVMK | 0.000 | 0.000 | 0.000 | 0.000 | 0.000 | 0.000 | 0.948 | 0.052 | ||
| 11 spectra, FLIDGFPR | 0.000 | 0.000 | 0.000 | 0.000 | 0.000 | 0.000 | 0.992 | 0.008 |
| Plot | Mito | Lyso or Perox | ER | Golgi | PM | Cytosol | Nucleus | ||||||
| Expt B |
4 peptides |
14 spectra |
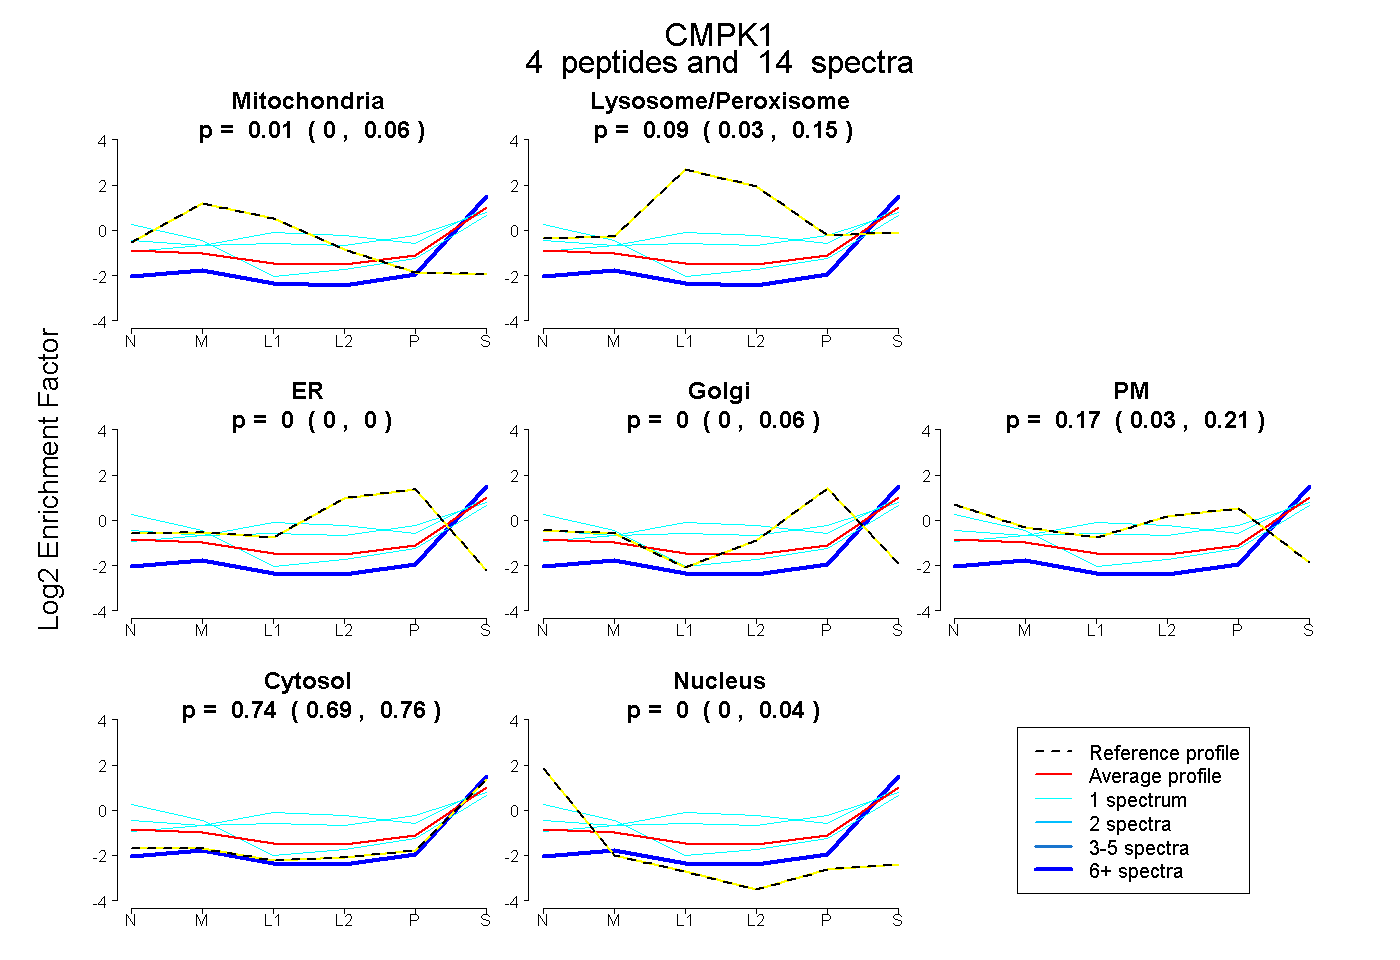 |
0.006 0.000 | 0.063 |
0.092 0.031 | 0.154 |
0.000 0.000 | 0.000 |
0.000 0.000 | 0.061 |
0.165 0.031 | 0.214 |
0.736 0.685 | 0.764 |
0.000 0.000 | 0.044 |
|||
| Plot | Lyso | Other | |||||||||||
| Expt C |
6 peptides |
31 spectra |
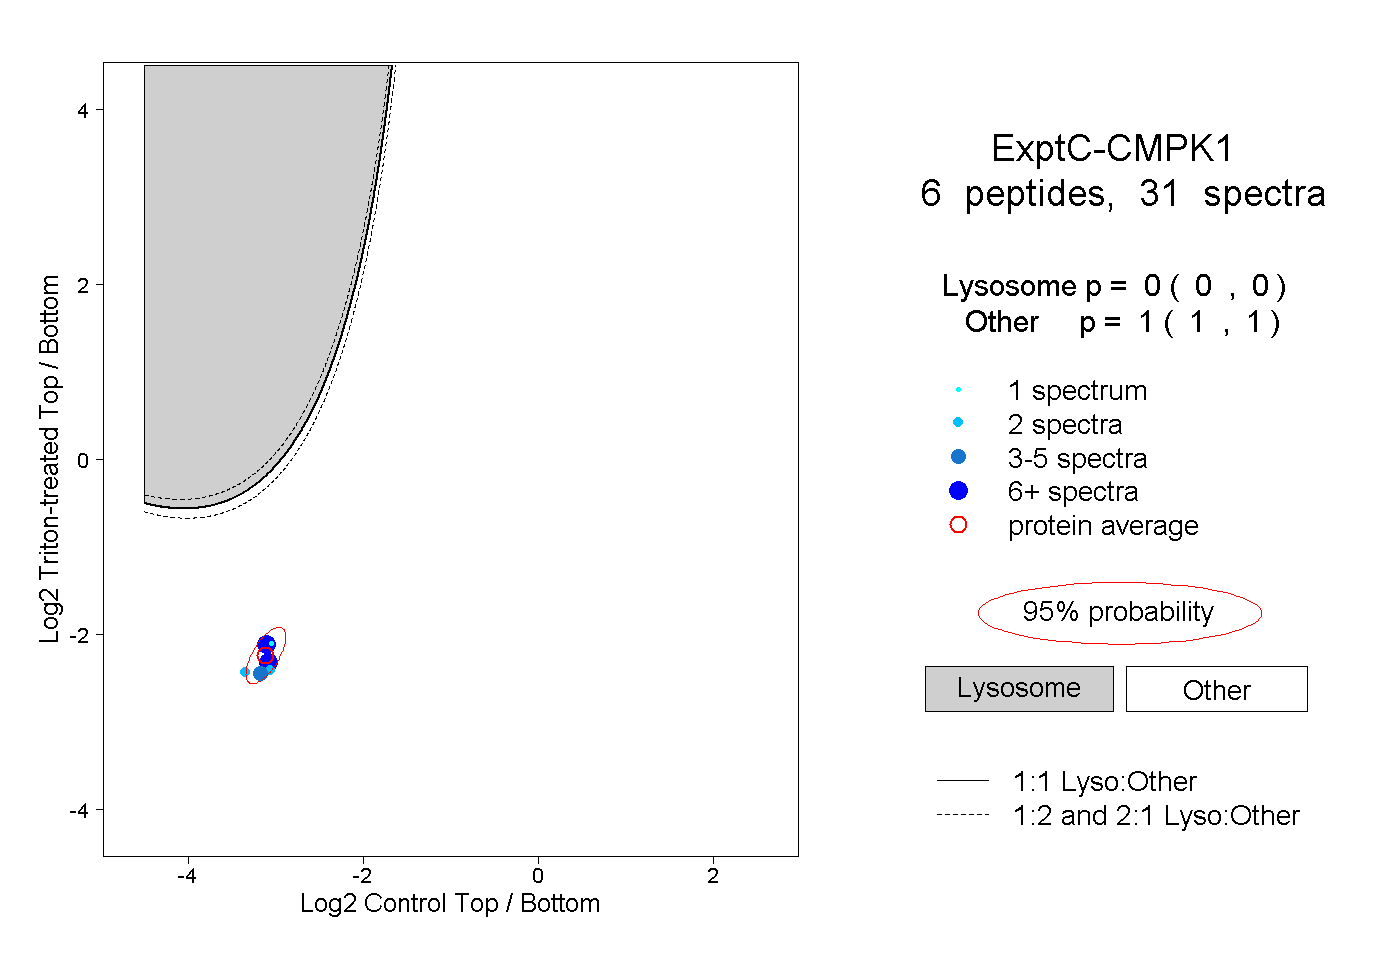 |
0.000 0.000 | 0.000 |
1.000 1.000 | 1.000 |
||||||||
| Plot | Lyso | Other | |||||||||||
| Expt D |
1 peptide |
2 spectra |
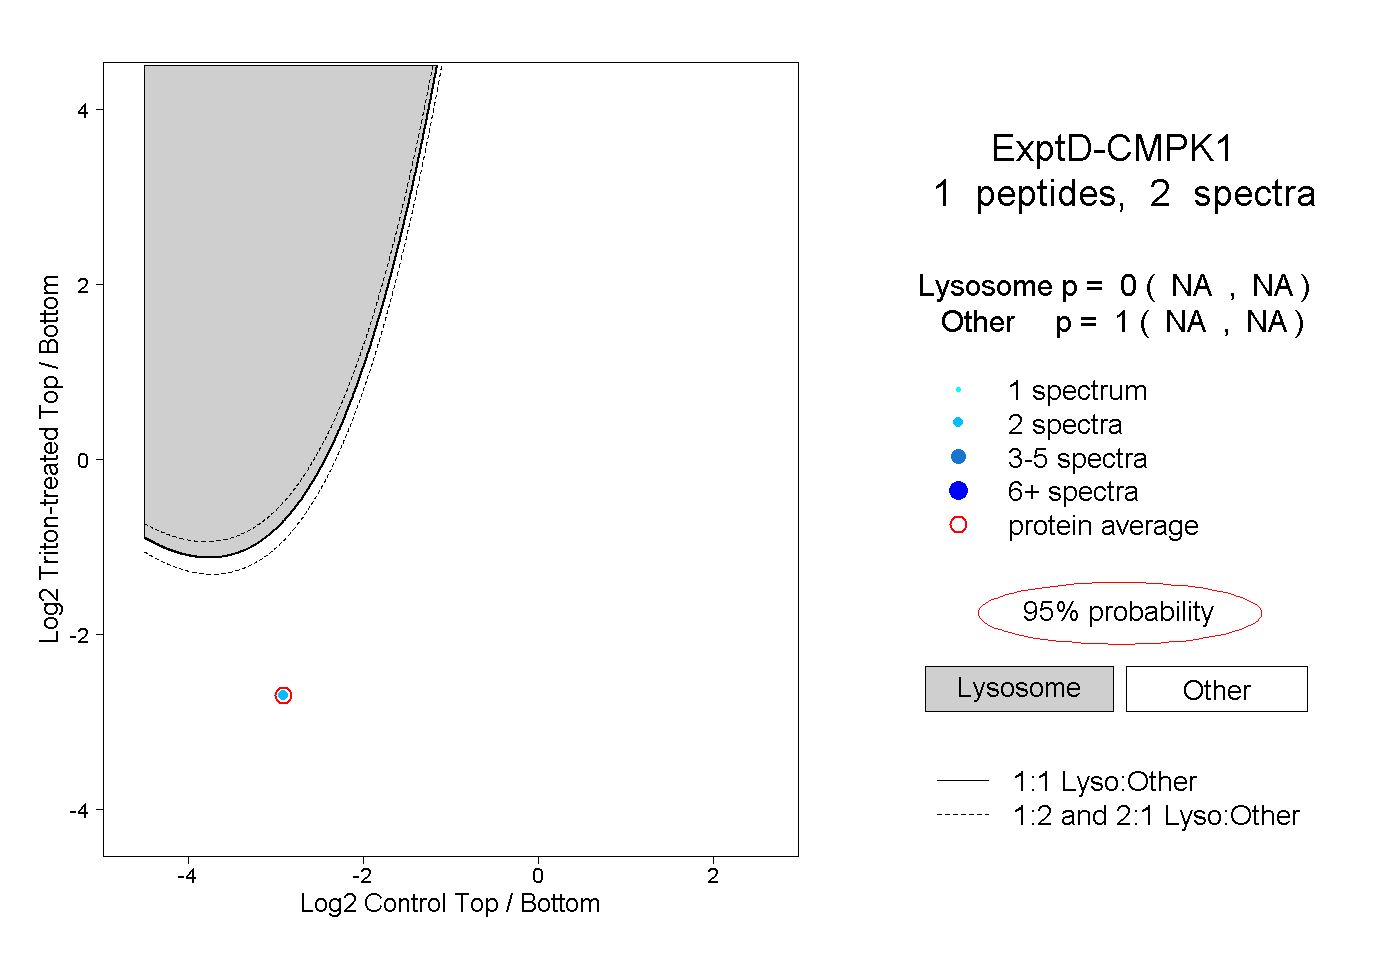 |
0.000 NA | NA |
1.000 NA | NA |