 13
13peptides
spectra
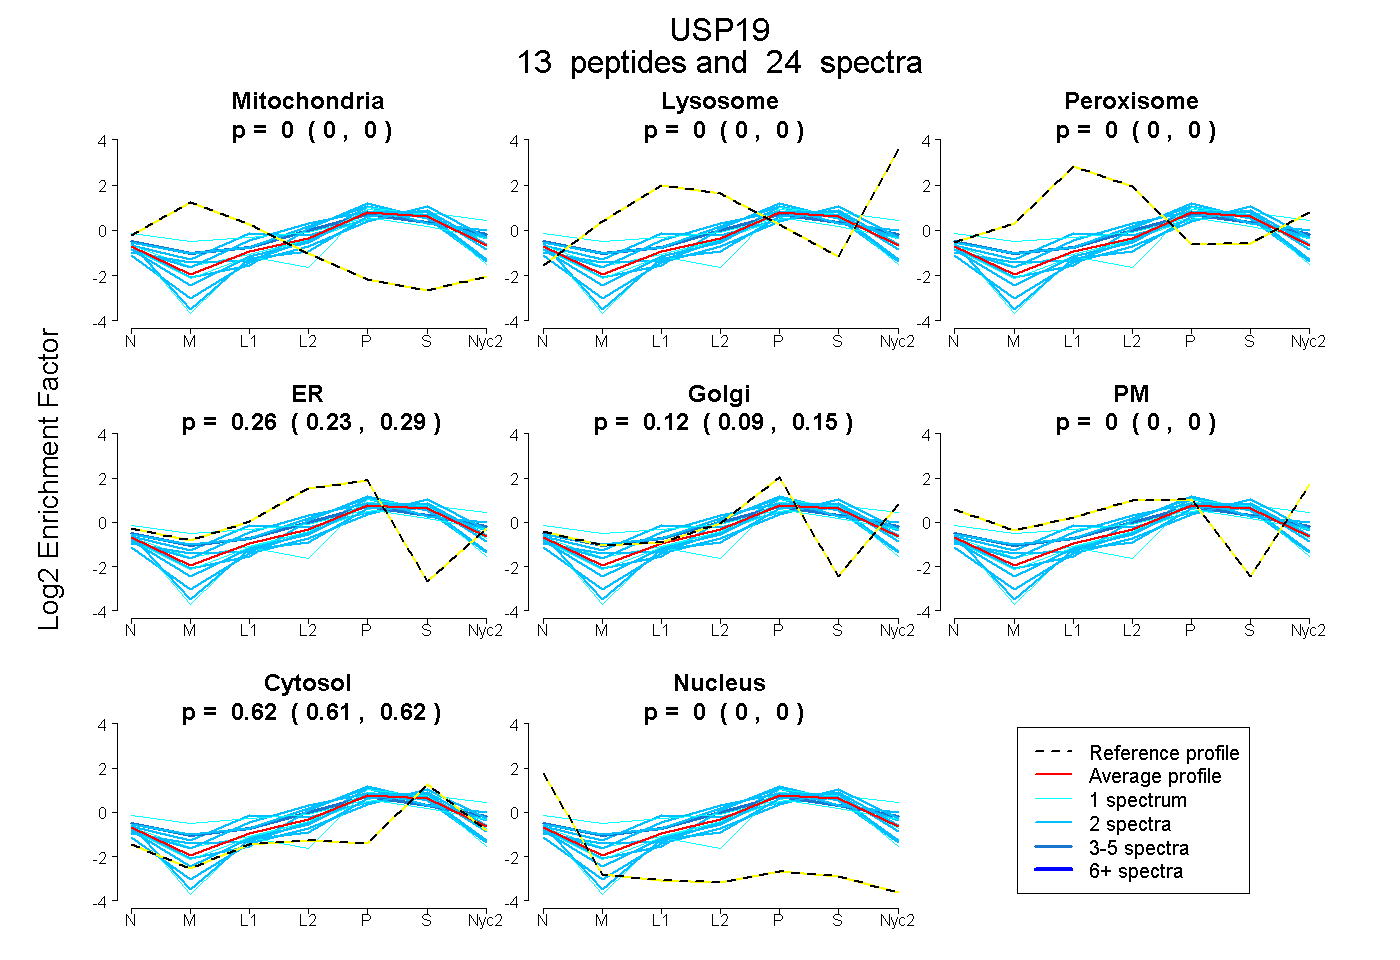
0.000 | 0.000
0.000 | 0.000
0.000 | 0.000
0.235 | 0.285
0.094 | 0.147
0.000 | 0.000
0.607 | 0.622
0.000 | 0.000
3peptides
spectra
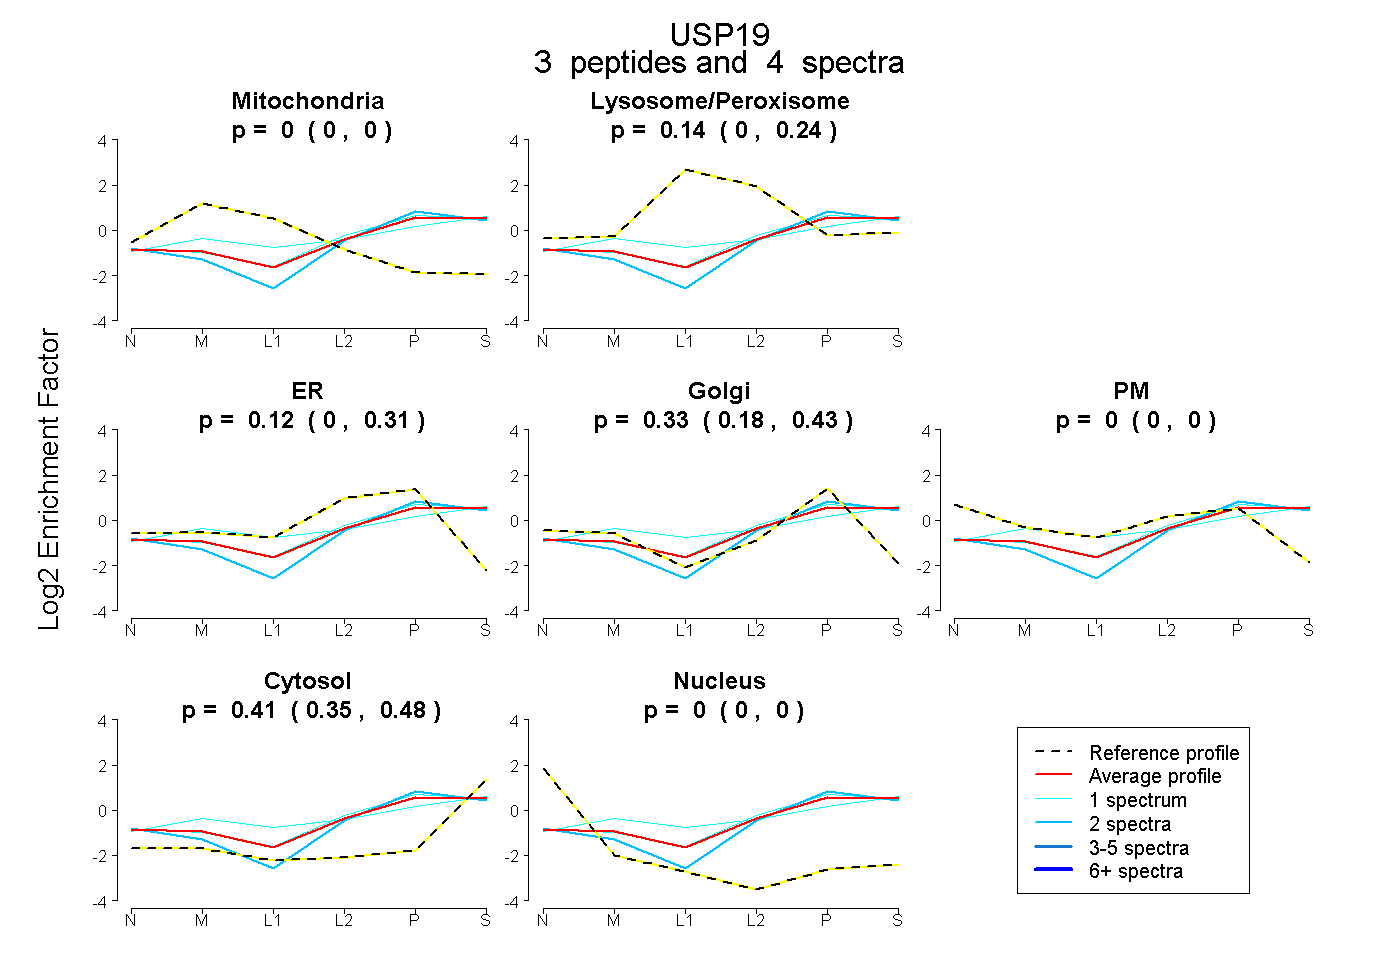
0.000 | 0.000
0.000 | 0.235
0.000 | 0.306
0.178 | 0.426
0.000 | 0.000
0.353 | 0.478
0.000 | 0.000
13peptides
spectra
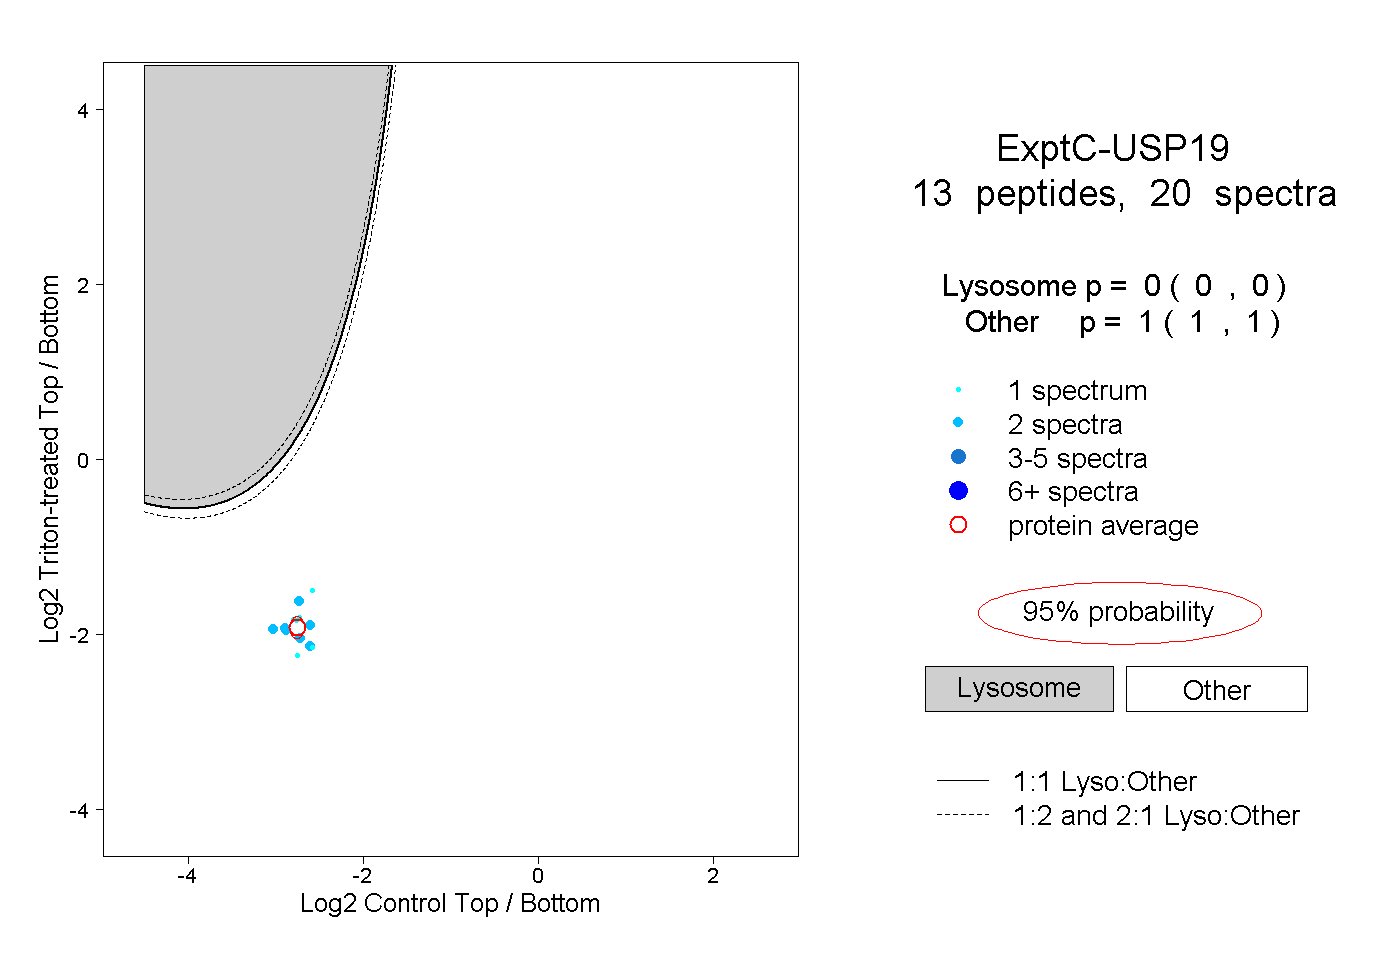
0.000 | 0.000
1.000 | 1.000
1peptide
spectra
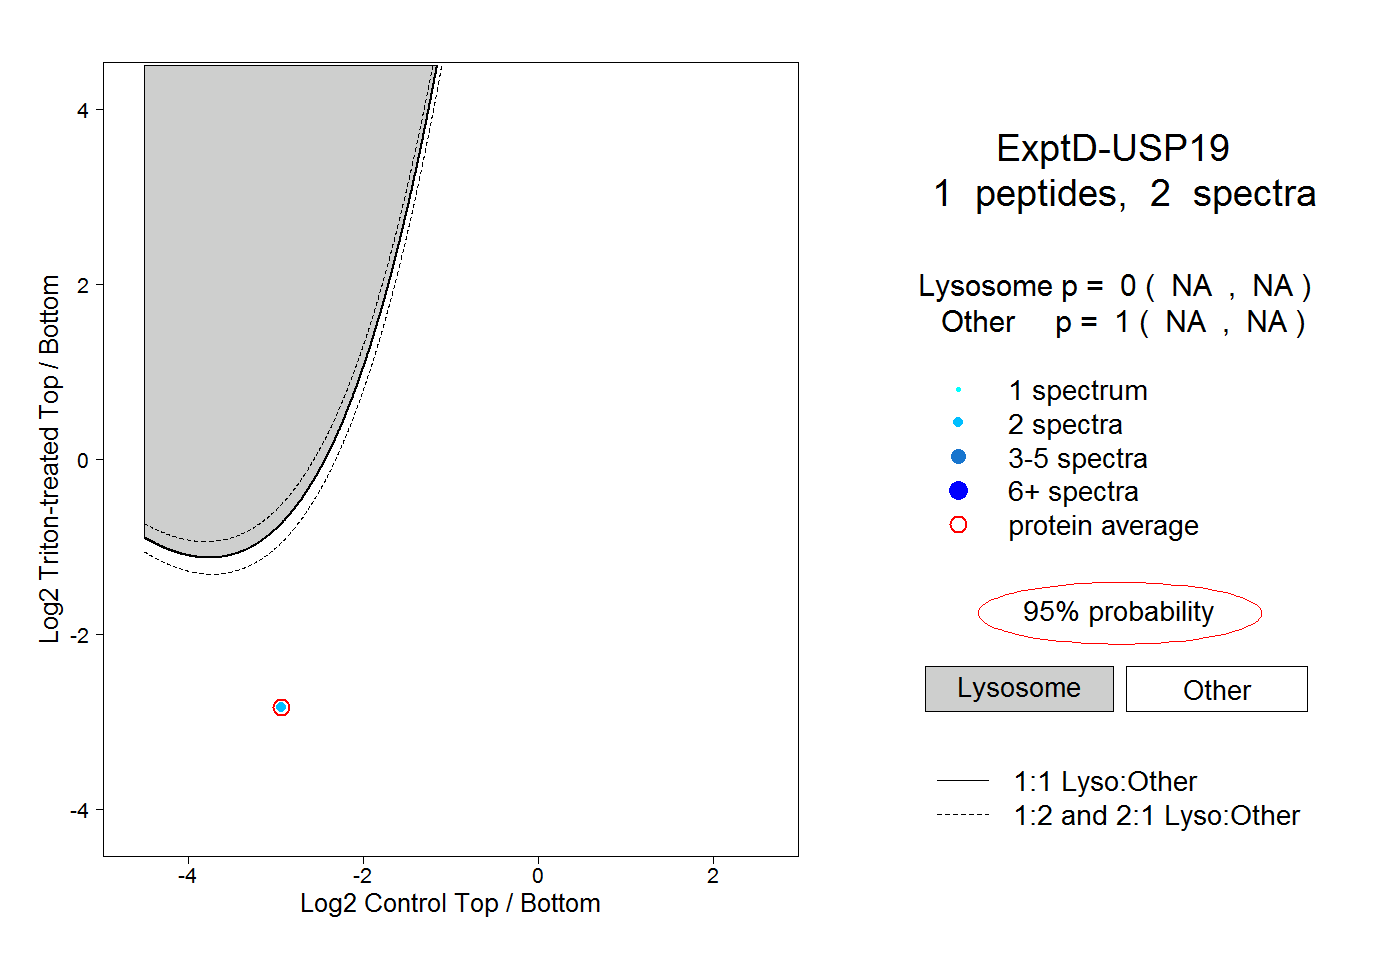
NA | NA
NA | NA