 13
13peptides
spectra
0.000 | 0.000
0.000 | 0.000
0.000 | 0.000
0.235 | 0.285
0.094 | 0.147
0.000 | 0.000
0.607 | 0.622
0.000 | 0.000
| Plot | Mito | Lyso | Perox | ER | Golgi | PM | Cytosol | Nucleus | |||||
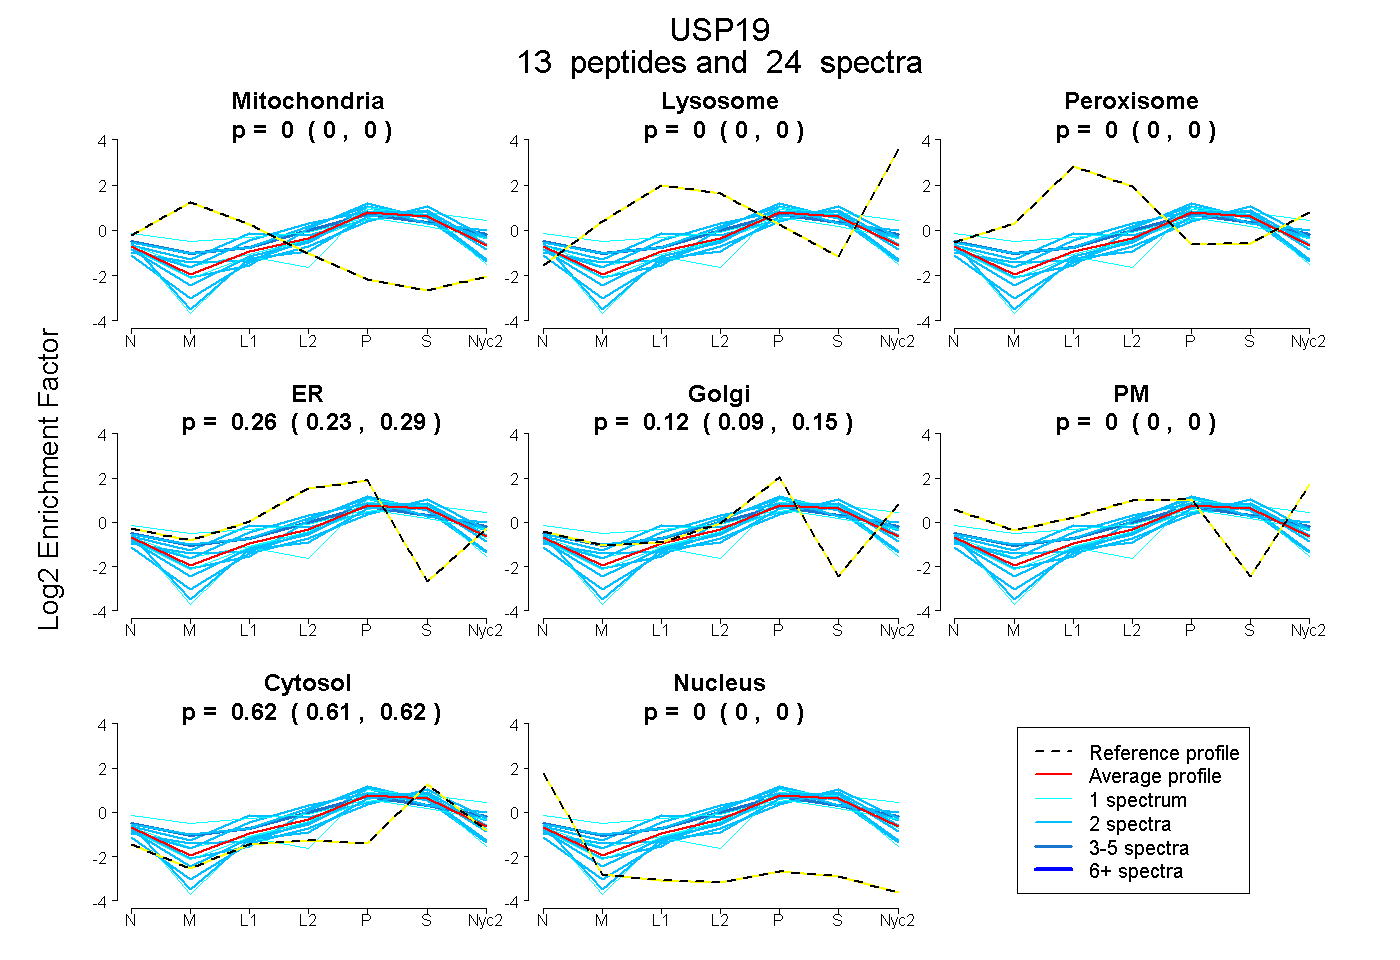
| Expt A |
13 peptides |
24 spectra |
|
0.000 0.000 | 0.000 |
0.000 0.000 | 0.000 |
0.000 0.000 | 0.000 |
0.263 0.235 | 0.285 |
0.122 0.094 | 0.147 |
0.000 0.000 | 0.000 |
0.615 0.607 | 0.622 |
0.000 0.000 | 0.000 |
| 1 spectrum, LVCPVCAK | 0.000 | 0.000 | 0.000 | 0.333 | 0.000 | 0.000 | 0.667 | 0.000 | ||
| 2 spectra, VLPIYYFAR | 0.000 | 0.000 | 0.000 | 0.185 | 0.142 | 0.000 | 0.673 | 0.000 | ||
| 2 spectra, LQEFVLVASK | 0.000 | 0.000 | 0.000 | 0.186 | 0.269 | 0.000 | 0.545 | 0.000 | ||
| 2 spectra, THWPDHK | 0.000 | 0.000 | 0.038 | 0.400 | 0.000 | 0.000 | 0.562 | 0.000 | ||
| 1 spectrum, SEDSGLDGVVAR | 0.000 | 0.000 | 0.000 | 0.000 | 0.280 | 0.000 | 0.708 | 0.012 | ||
| 2 spectra, LAQLLEGYAR | 0.000 | 0.000 | 0.131 | 0.134 | 0.330 | 0.000 | 0.404 | 0.000 | ||
| 1 spectrum, GEVGSGASPGAQAGPSAK | 0.000 | 0.120 | 0.000 | 0.000 | 0.291 | 0.010 | 0.580 | 0.000 | ||
| 2 spectra, LHPGCGPHTIFR | 0.000 | 0.000 | 0.000 | 0.000 | 0.241 | 0.000 | 0.759 | 0.000 | ||
| 4 spectra, LAEVIK | 0.000 | 0.000 | 0.131 | 0.136 | 0.270 | 0.000 | 0.462 | 0.000 | ||
| 1 spectrum, VSRPEAAVPGYQHSR | 0.033 | 0.000 | 0.226 | 0.085 | 0.276 | 0.000 | 0.380 | 0.000 | ||
| 2 spectra, DFFHDR | 0.000 | 0.000 | 0.130 | 0.291 | 0.000 | 0.000 | 0.579 | 0.000 | ||
| 2 spectra, WGGLEAPATR | 0.000 | 0.000 | 0.000 | 0.000 | 0.260 | 0.000 | 0.740 | 0.000 | ||
| 2 spectra, GLCRPENIGYPFLVSVPASR | 0.000 | 0.000 | 0.000 | 0.326 | 0.065 | 0.000 | 0.609 | 0.000 |
| Plot | Mito | Lyso or Perox | ER | Golgi | PM | Cytosol | Nucleus | ||||||
| Expt B |
3 peptides |
4 spectra |
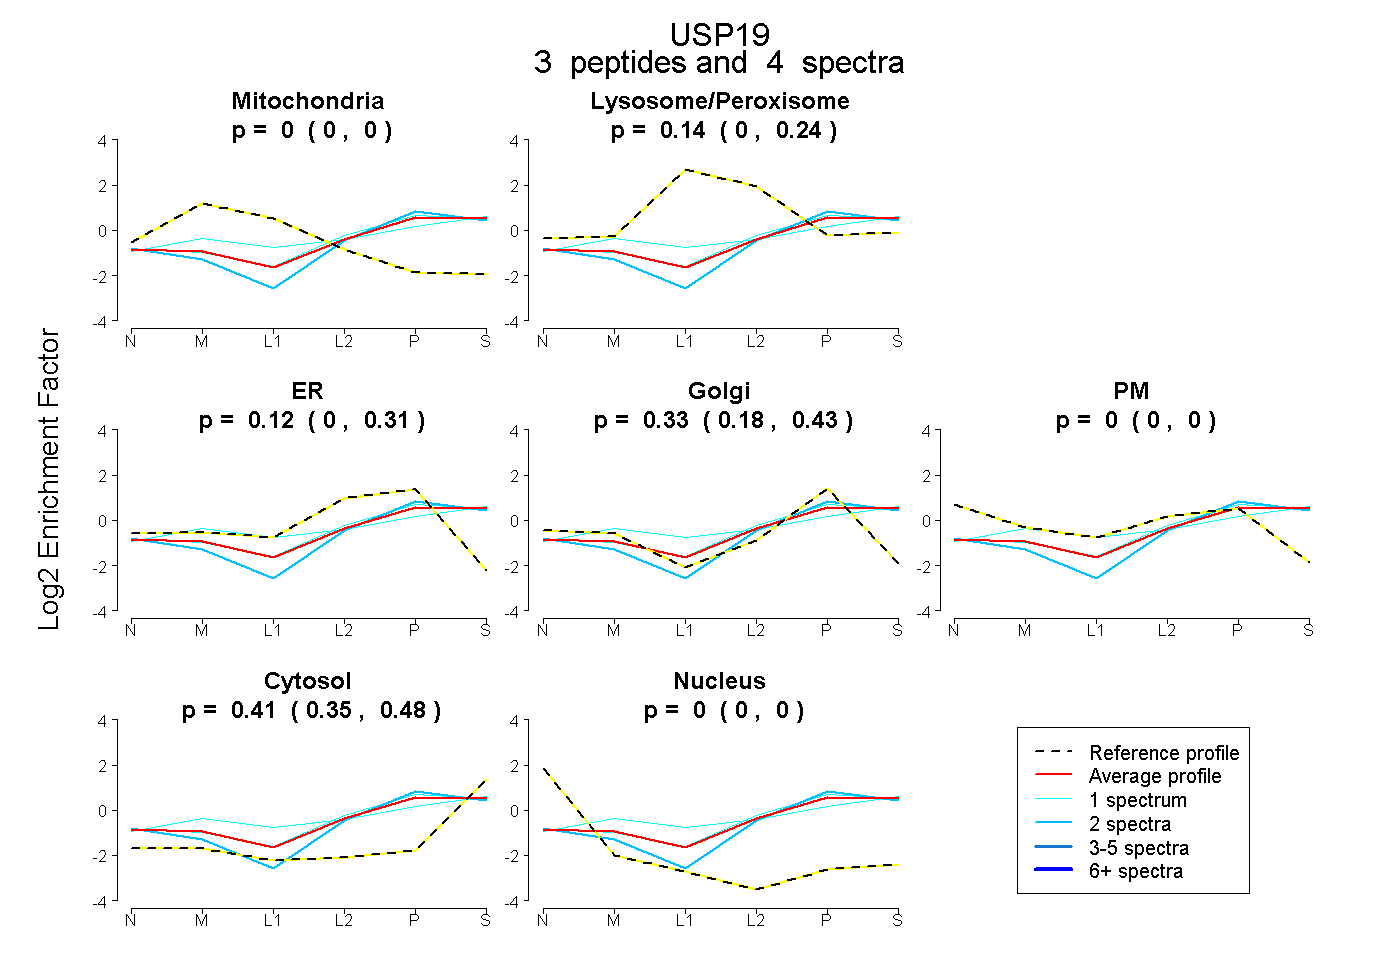 |
0.000 0.000 | 0.000 |
0.138 0.000 | 0.235 |
0.116 0.000 | 0.306 |
0.334 0.178 | 0.426 |
0.000 0.000 | 0.000 |
0.411 0.353 | 0.478 |
0.000 0.000 | 0.000 |
|||
| Plot | Lyso | Other | |||||||||||
| Expt C |
13 peptides |
20 spectra |
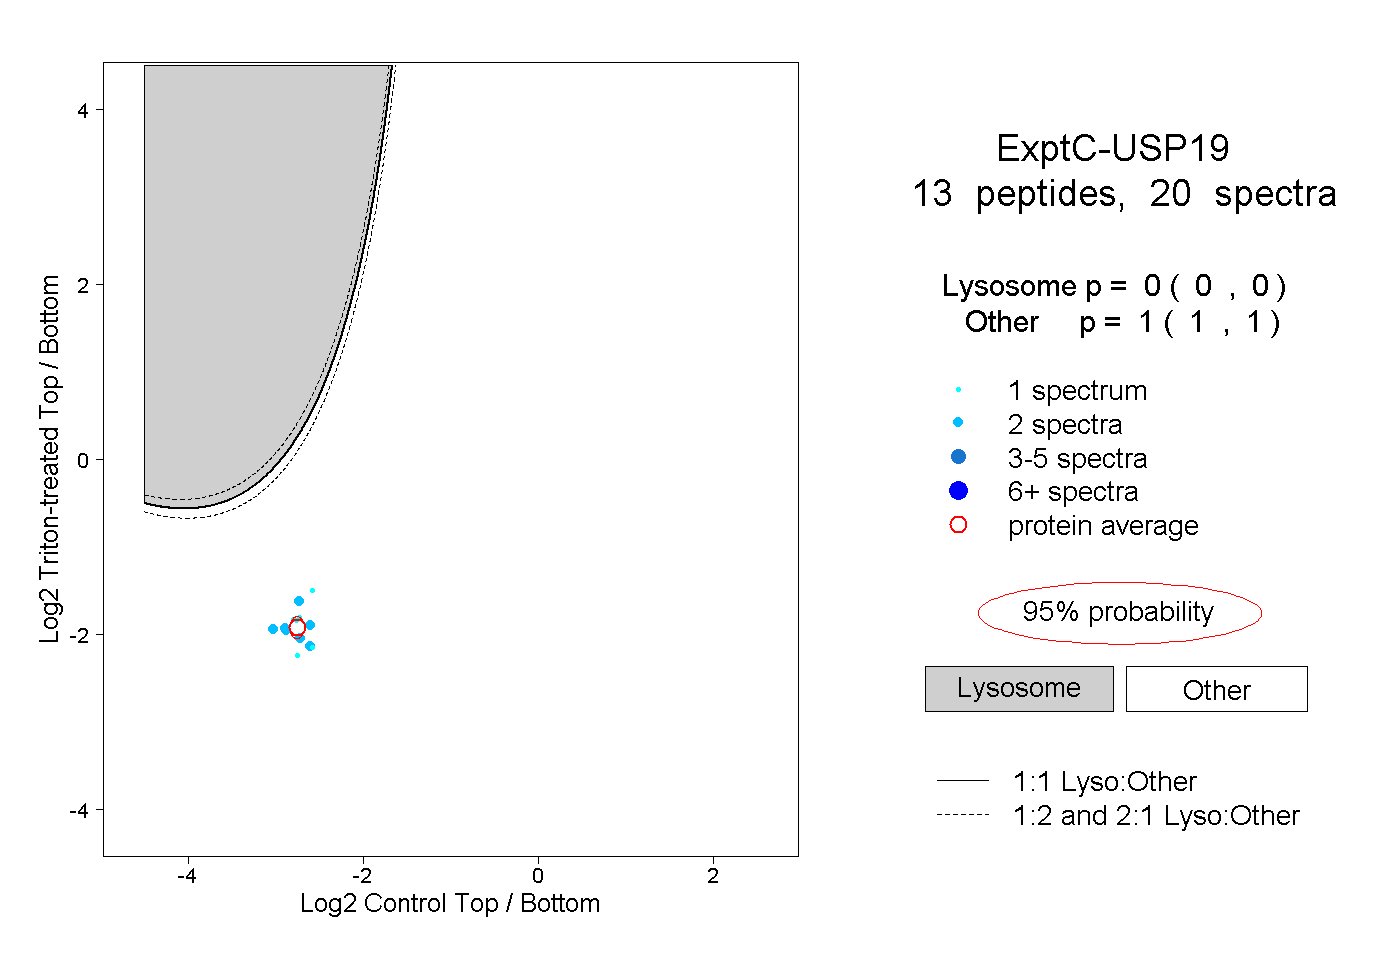 |
0.000 0.000 | 0.000 |
1.000 1.000 | 1.000 |
||||||||
| Plot | Lyso | Other | |||||||||||
| Expt D |
1 peptide |
2 spectra |
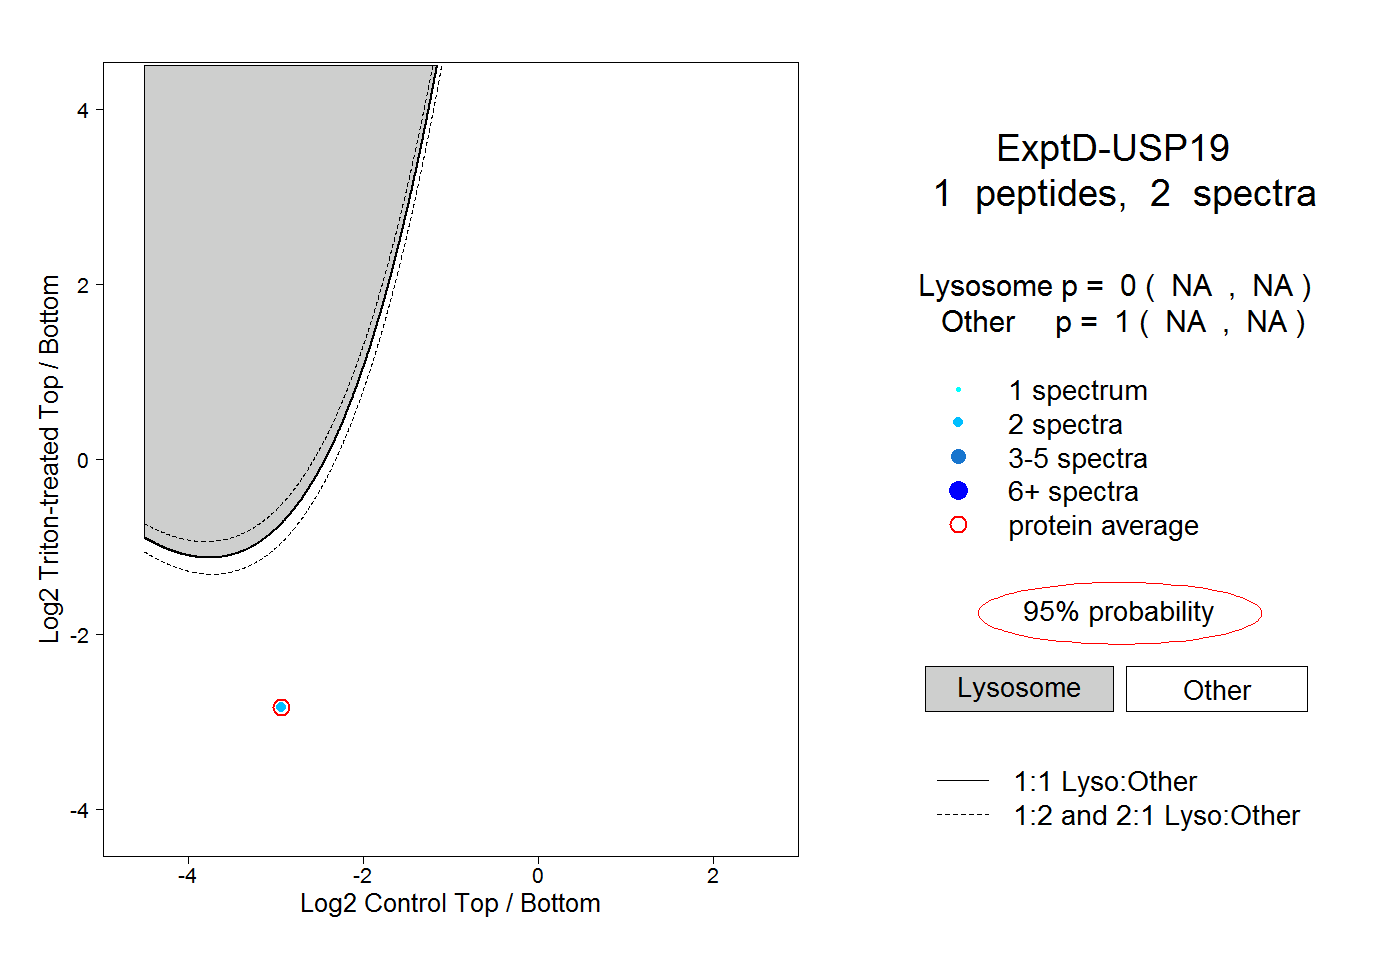 |
0.000 NA | NA |
1.000 NA | NA |