USP19
[ENSRNOP00000067744]
Main page
| | | Plot |
Mito |
Lyso |
|
Perox |
ER |
Golgi |
PM |
Cytosol |
Nucleus |
|
| Expt A |
 13
13
peptides |
24
spectra |
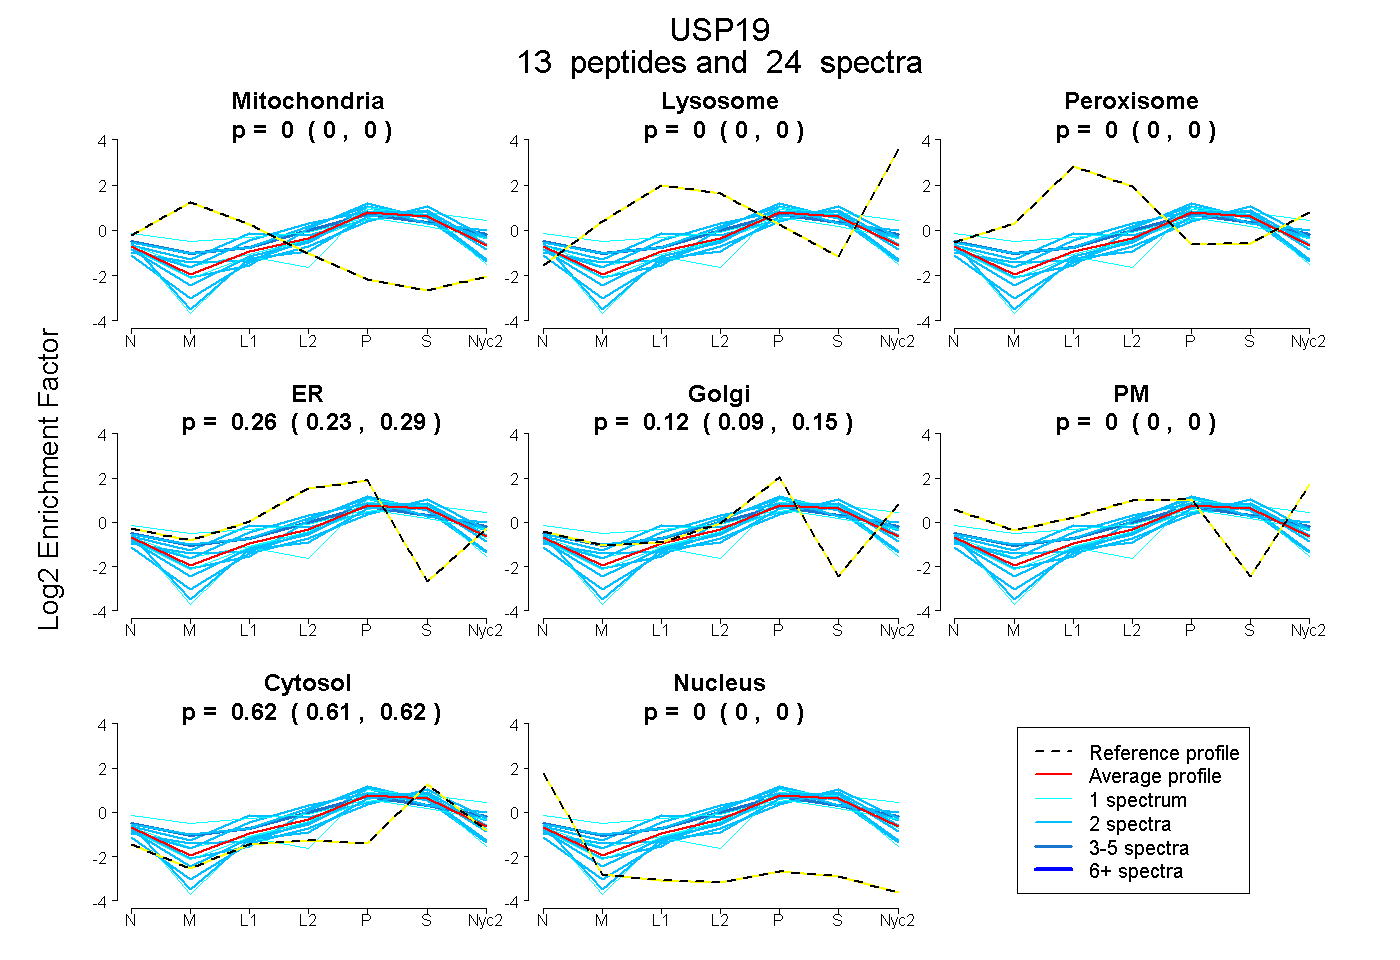 |
0.000
0.000 | 0.000 |
0.000
0.000 | 0.000 |
|
0.000
0.000 | 0.000 |
0.263
0.235 | 0.285 |
0.122
0.094 | 0.147 |
0.000
0.000 | 0.000 |
0.615
0.607 | 0.622 |
0.000
0.000 | 0.000 |
|
| | | Plot |
Mito |
|
Lyso or Perox |
|
ER |
Golgi |
PM |
Cytosol |
Nucleus |
|
| Expt B |
3
peptides |
4
spectra |
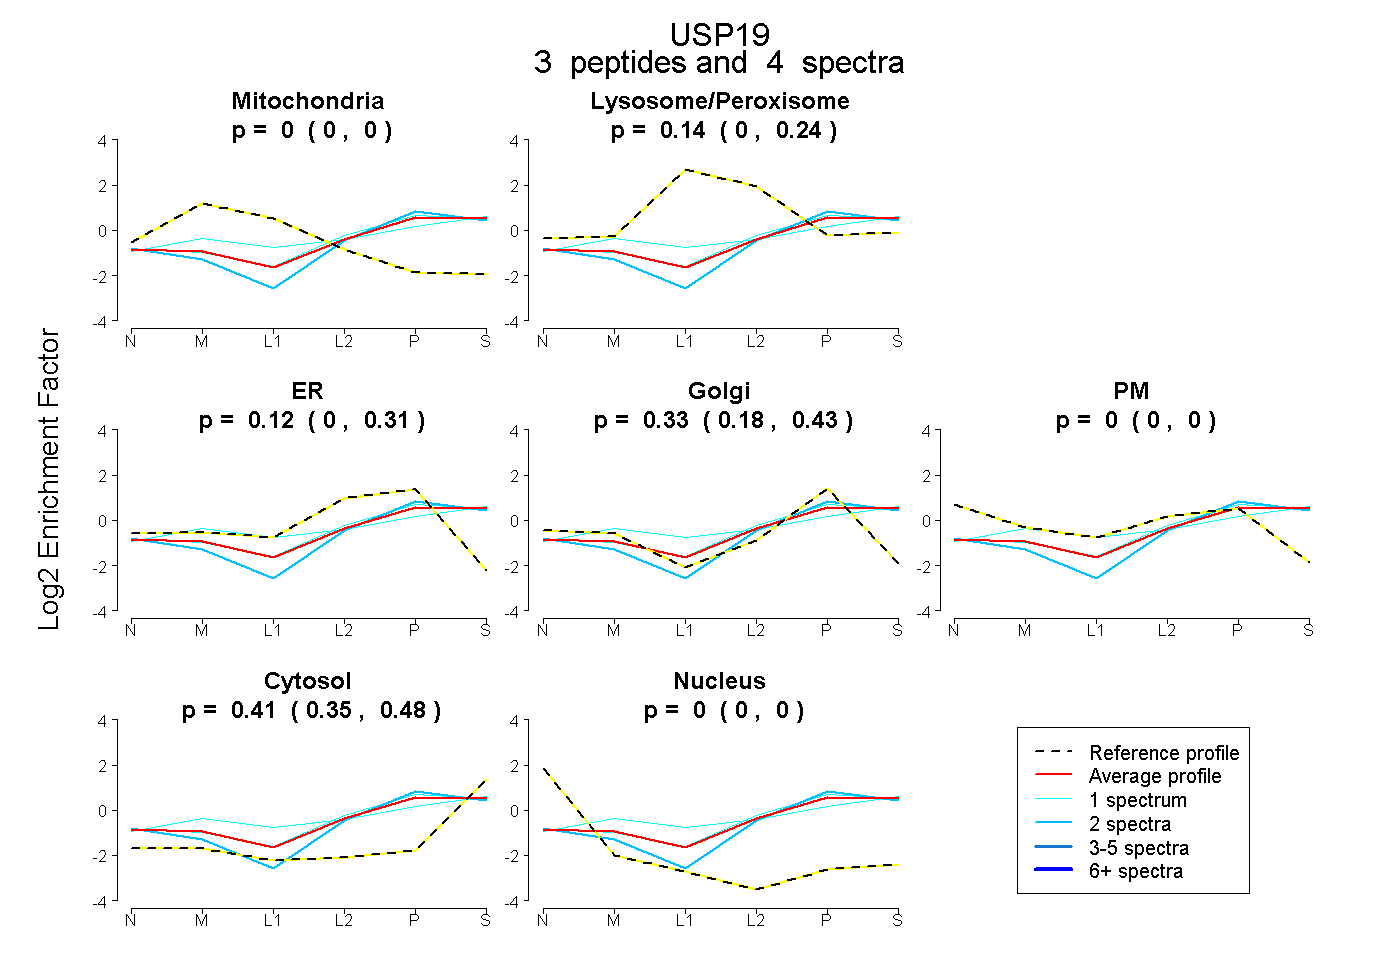 |
0.000
0.000 | 0.000 |
|
0.138
0.000 | 0.235 |
|
0.116
0.000 | 0.306 |
0.334
0.178 | 0.426 |
0.000
0.000 | 0.000 |
0.411
0.353 | 0.478 |
0.000
0.000 | 0.000 |
|
| | | Plot |
|
Lyso |
|
|
|
|
|
|
|
Other |
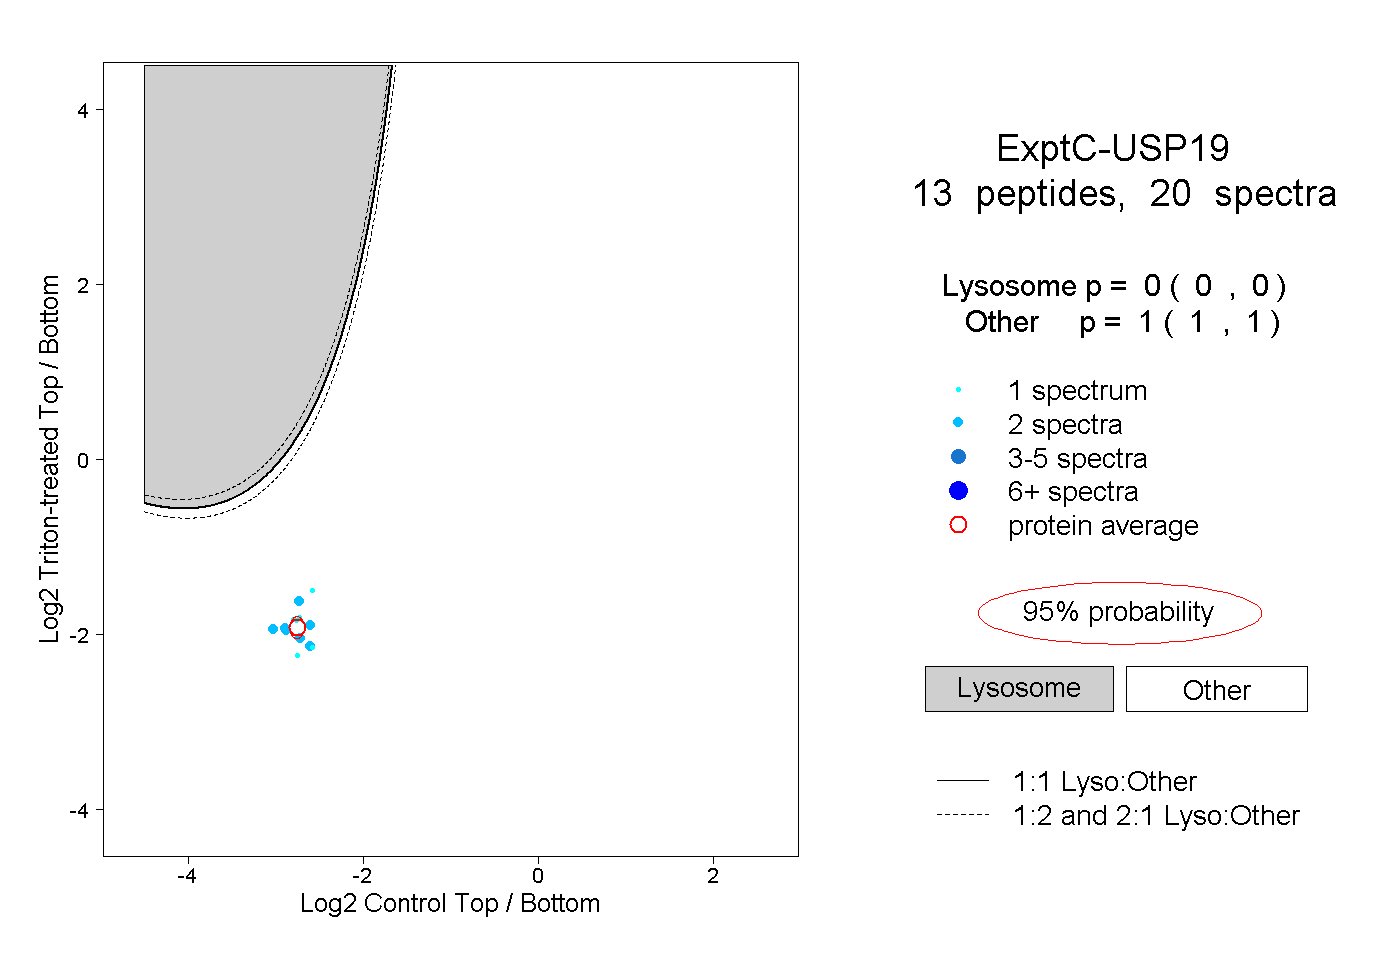
| Expt C |
13
peptides |
20
spectra |
 |
|
0.000
0.000 | 0.000 |
|
|
|
|
|
|
|
1.000
1.000 | 1.000 |
| 2 spectra, LVCPVCAK |
|
0.000 |
|
|
|
|
|
|
|
1.000 |
| 2 spectra, VLPIYYFAR |
|
0.000 |
|
|
|
|
|
|
|
1.000 |
| 2 spectra, IDASSR |
|
0.000 |
|
|
|
|
|
|
|
1.000 |
| 1 spectrum, GPTTSDEGCLR |
|
0.000 |
|
|
|
|
|
|
|
1.000 |
| 2 spectra, INDLVEFPVR |
|
0.000 |
|
|
|
|
|
|
|
1.000 |
| 1 spectrum, QQSEDEK |
|
0.000 |
|
|
|
|
|
|
|
1.000 |
| 1 spectrum, SEDSGLDGVVAR |
|
0.000 |
|
|
|
|
|
|
|
1.000 |
| 2 spectra, LAQLLEGYAR |
|
0.000 |
|
|
|
|
|
|
|
1.000 |
| 2 spectra, IDICLR |
|
0.000 |
|
|
|
|
|
|
|
1.000 |
| 1 spectrum, LPNVLIVQLK |
|
0.000 |
|
|
|
|
|
|
|
1.000 |
| 1 spectrum, LAEVIK |
|
0.000 |
|
|
|
|
|
|
|
1.000 |
| 2 spectra, DFFHDR |
|
0.000 |
|
|
|
|
|
|
|
1.000 |
| 1 spectrum, NSPVERPPR |
|
0.000 |
|
|
|
|
|
|
|
1.000 |
| | | Plot |
|
Lyso |
|
|
|
|
|
|
|
Other |
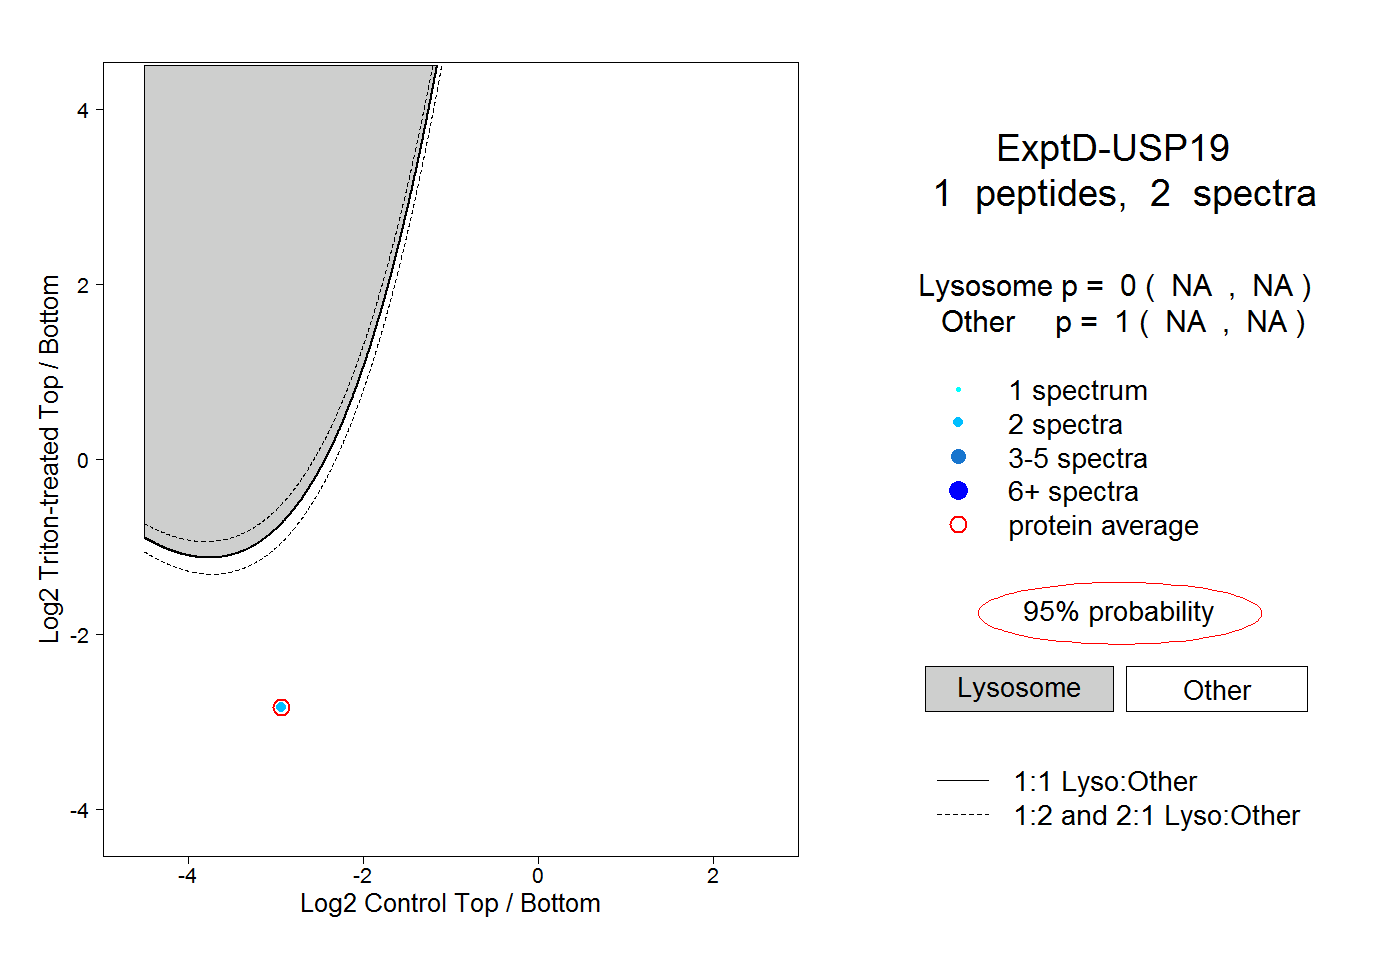
| Expt D |
1
peptide |
2
spectra |
 |
|
0.000
NA | NA |
|
|
|
|
|
|
|
1.000
NA | NA |