 20
20peptides
spectra
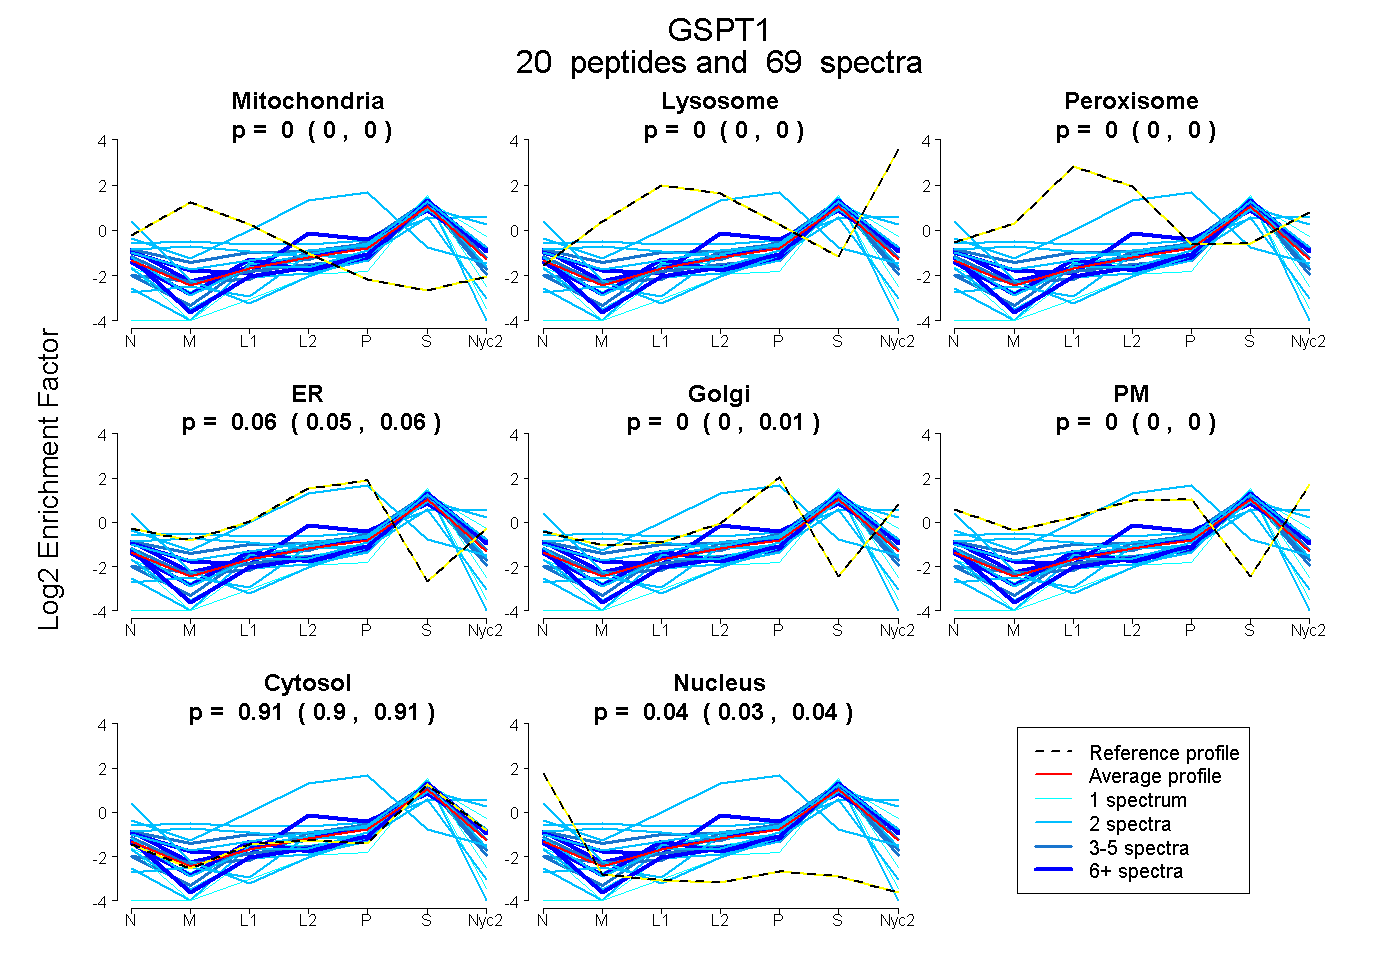
0.000 | 0.000
0.000 | 0.000
0.000 | 0.000
0.049 | 0.064
0.000 | 0.006
0.000 | 0.000
0.899 | 0.911
0.029 | 0.040
5peptides
spectra
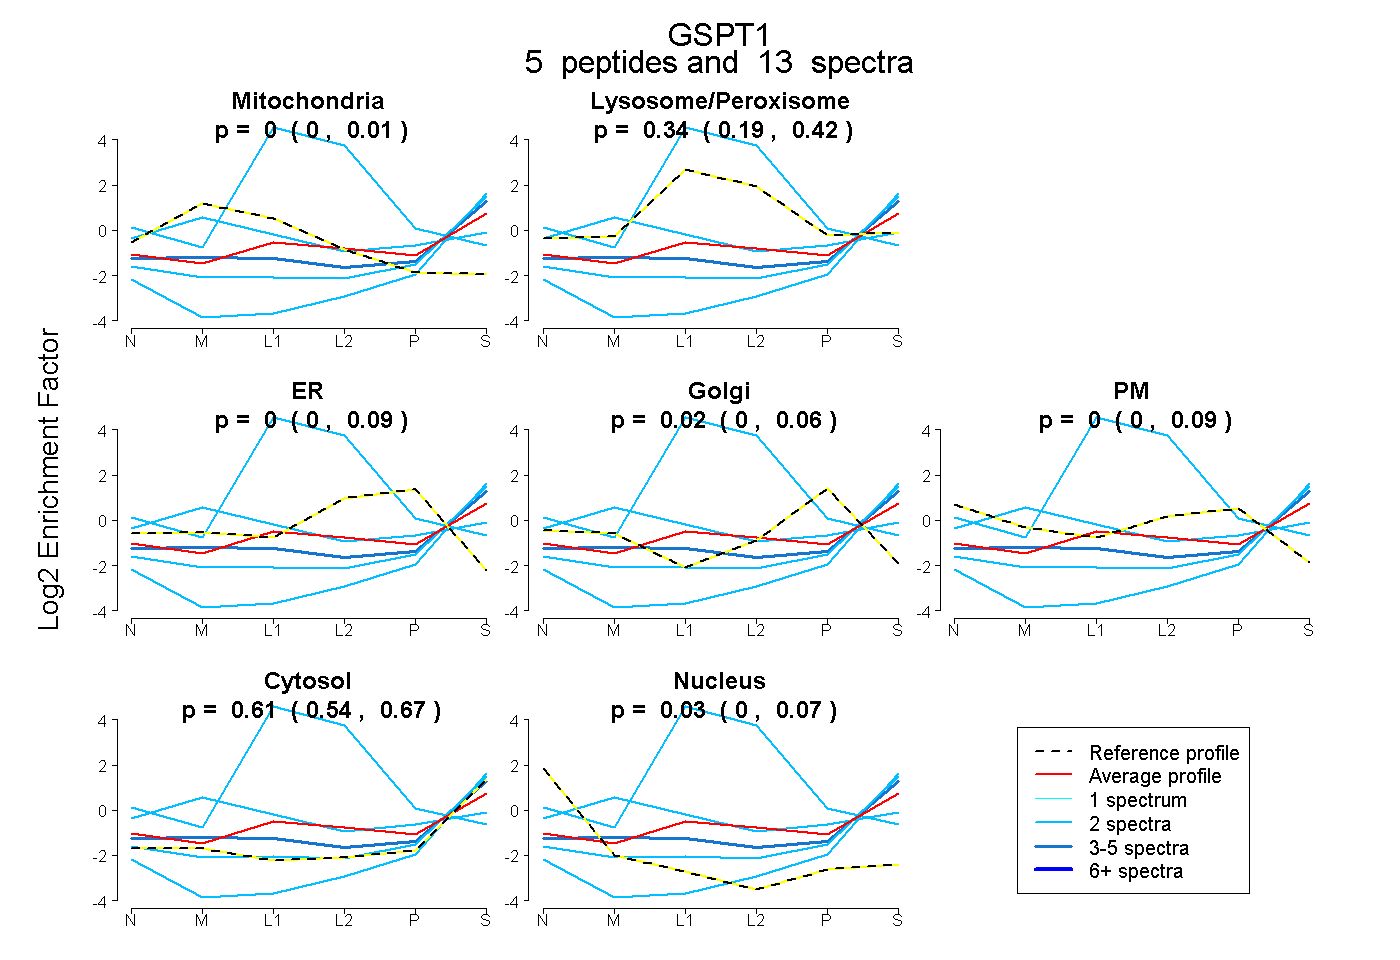
0.000 | 0.010
0.186 | 0.416
0.000 | 0.091
0.000 | 0.057
0.000 | 0.091
0.535 | 0.672
0.000 | 0.073
13peptides
spectra

0.000 | 0.996
0.004 | 1.000
3peptides
spectra
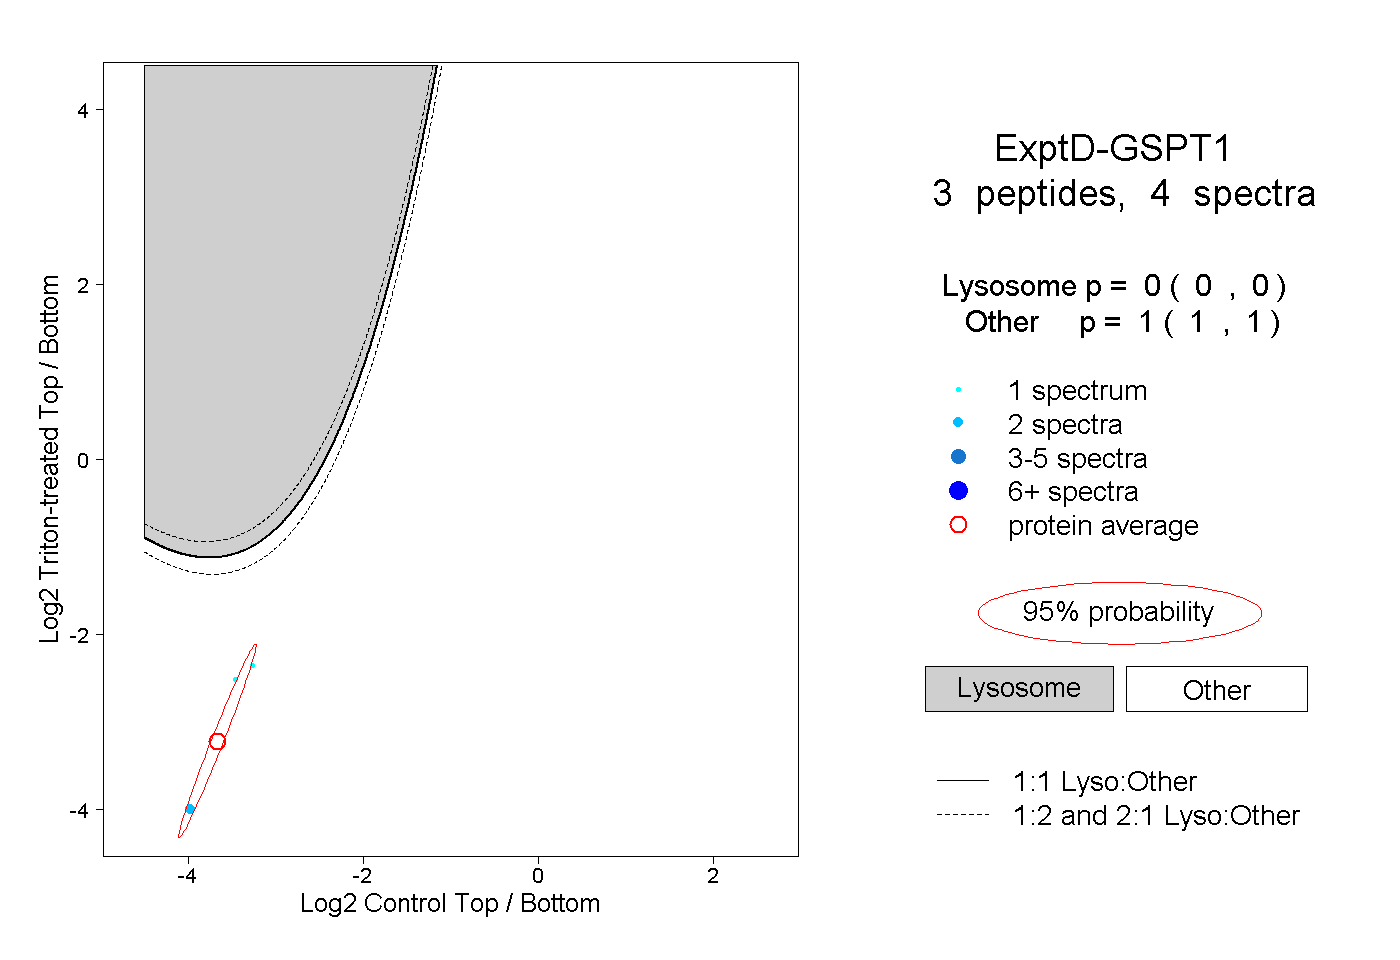
0.000 | 0.000
1.000 | 1.000