GSPT1
[ENSRNOP00000067103]
Main page
| | | Plot |
Mito |
Lyso |
|
Perox |
ER |
Golgi |
PM |
Cytosol |
Nucleus |
|
| Expt A |
 20
20
peptides |
69
spectra |
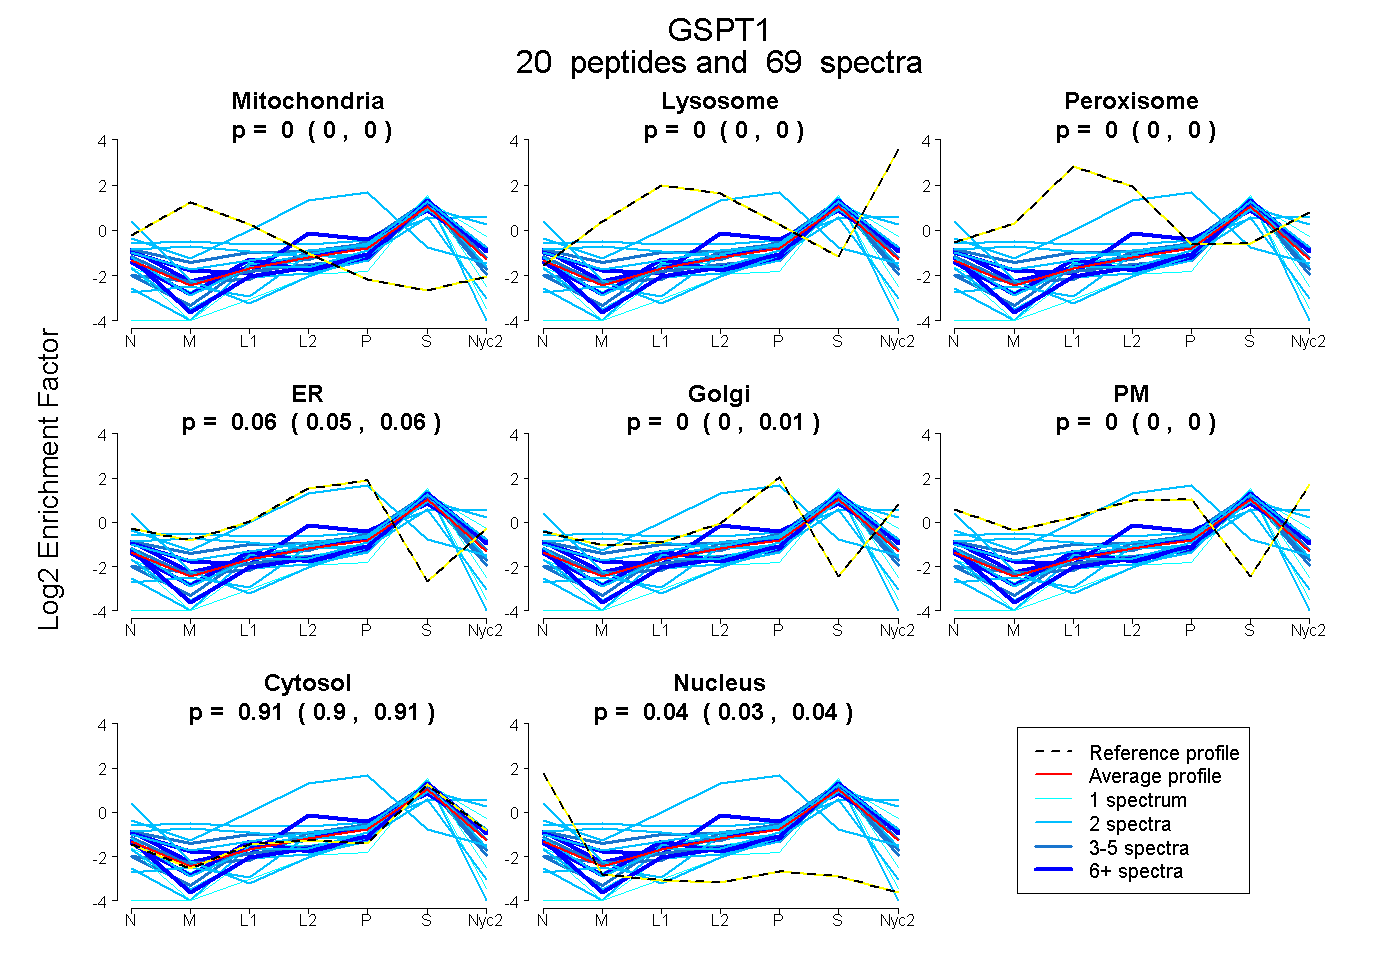 |
0.000
0.000 | 0.000 |
0.000
0.000 | 0.000 |
|
0.000
0.000 | 0.000 |
0.059
0.049 | 0.064 |
0.000
0.000 | 0.006 |
0.000
0.000 | 0.000 |
0.905
0.899 | 0.911 |
0.035
0.029 | 0.040 |
|
| | | Plot |
Mito |
|
Lyso or Perox |
|
ER |
Golgi |
PM |
Cytosol |
Nucleus |
|
| Expt B |
5
peptides |
13
spectra |
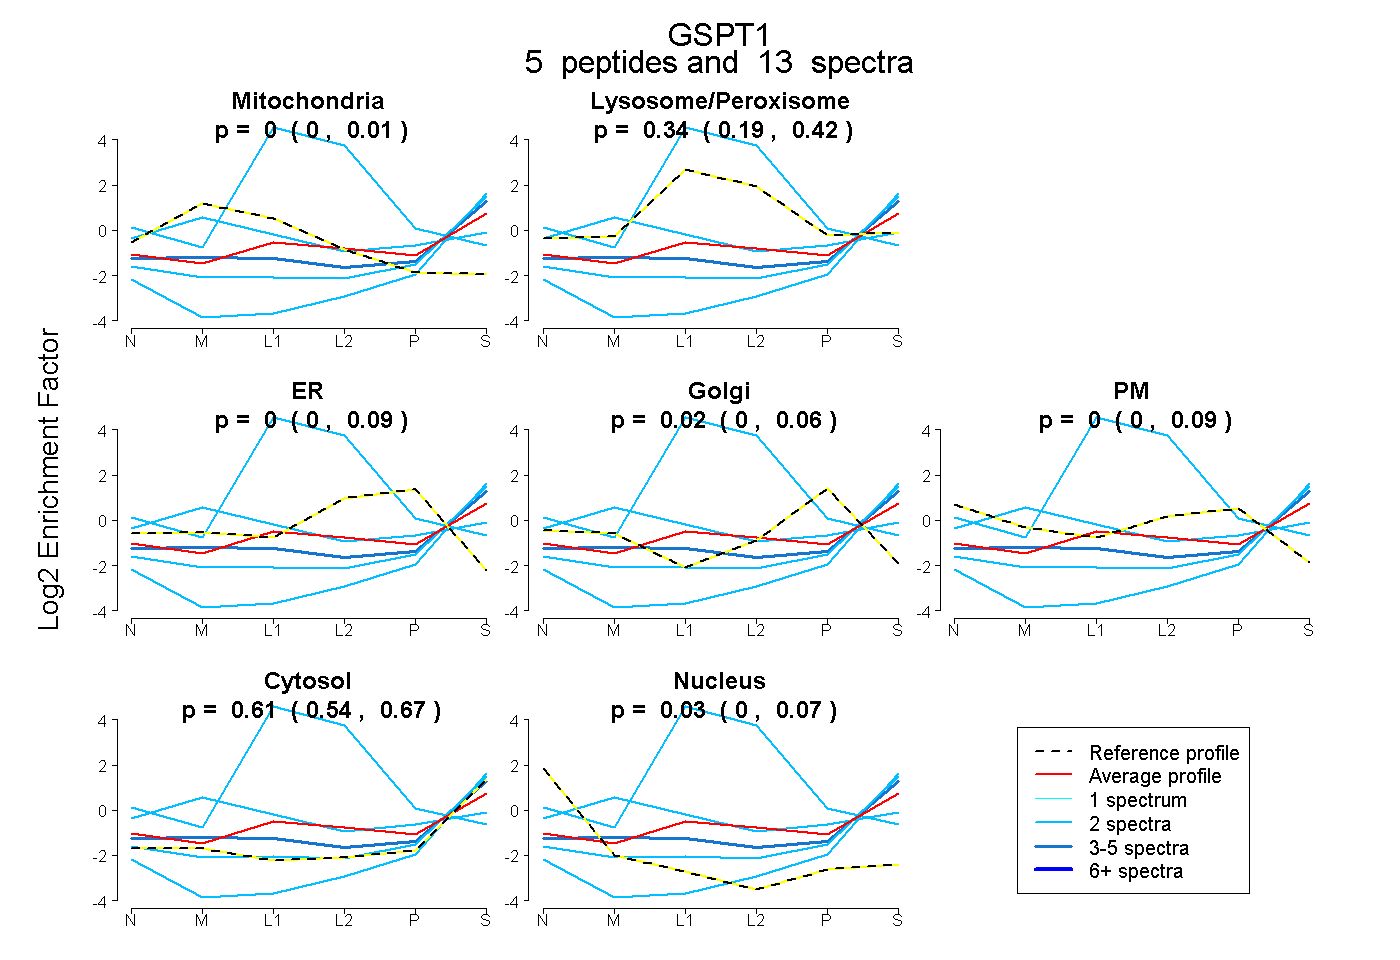 |
0.000
0.000 | 0.010 |
|
0.337
0.186 | 0.416 |
|
0.000
0.000 | 0.091 |
0.017
0.000 | 0.057 |
0.000
0.000 | 0.091 |
0.611
0.535 | 0.672 |
0.034
0.000 | 0.073 |
|
| 2 spectra, QDQVCIAR |
0.000 |
|
0.007 |
|
0.000 |
0.000 |
0.000 |
0.993 |
0.000 |
|
| 2 spectra, SVVAPPGAPK |
0.380 |
|
0.176 |
|
0.000 |
0.112 |
0.060 |
0.272 |
0.000 |
|
| 2 spectra, LIPFLK |
0.000 |
|
1.000 |
|
0.000 |
0.000 |
0.000 |
0.000 |
0.000 |
|
| 2 spectra, ENLSAAFSR |
0.000 |
|
0.000 |
|
0.000 |
0.000 |
0.000 |
0.998 |
0.002 |
|
| 5 spectra, HLIVLINK |
0.023 |
|
0.164 |
|
0.000 |
0.000 |
0.000 |
0.812 |
0.001 |
|
| | | Plot |
|
Lyso |
|
|
|
|
|
|
|
Other |
| Expt C |
13
peptides |
66
spectra |
 |
|
0.002
0.000 | 0.996 |
|
|
|
|
|
|
|
0.998
0.004 | 1.000 |
| | | Plot |
|
Lyso |
|
|
|
|
|
|
|
Other |
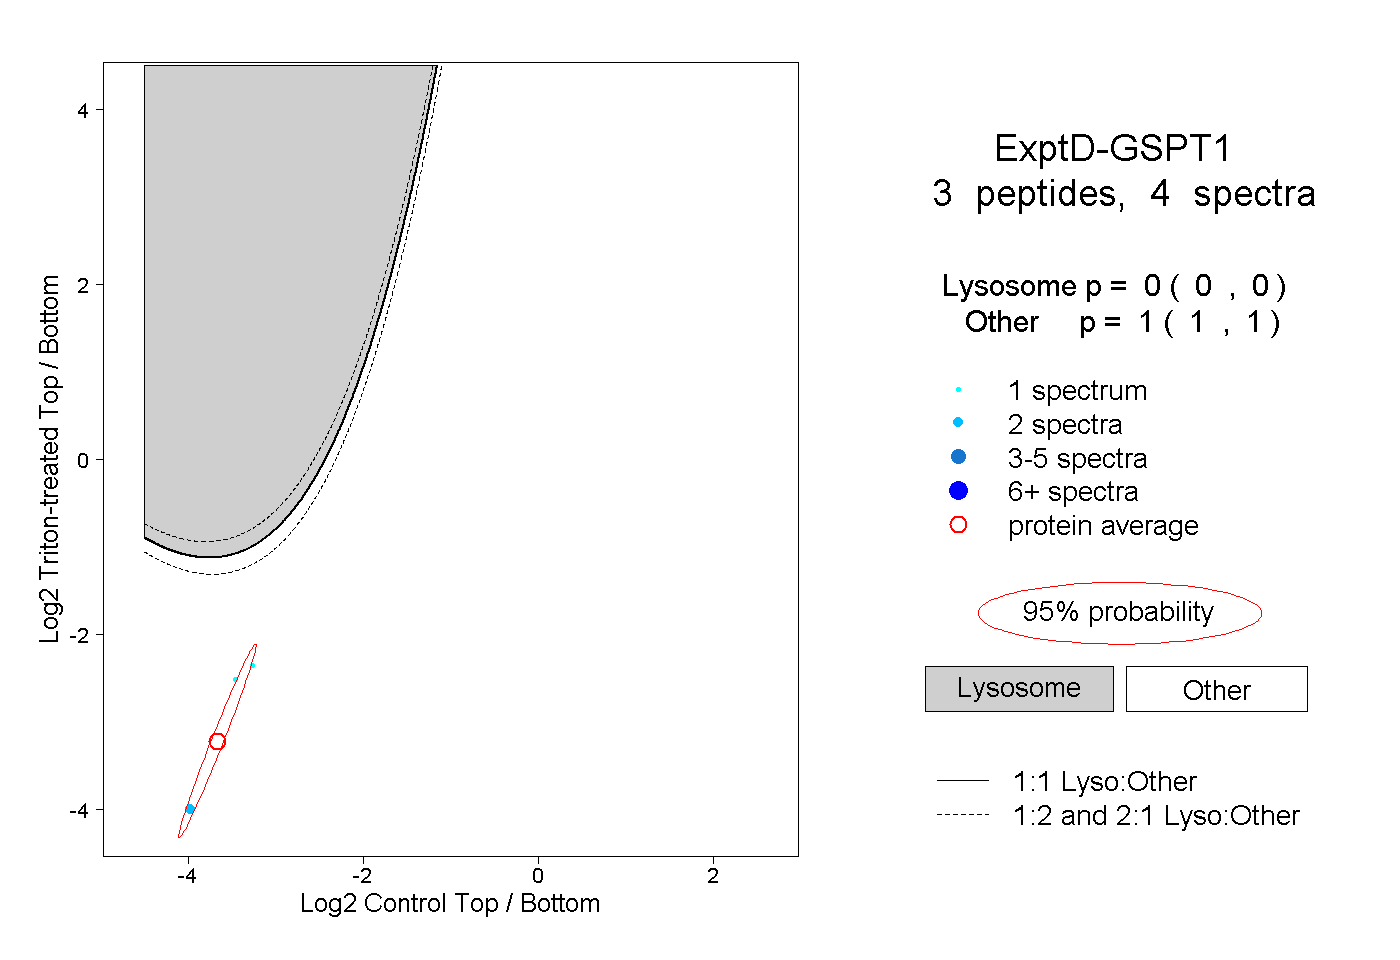
| Expt D |
3
peptides |
4
spectra |
 |
|
0.000
0.000 | 0.000 |
|
|
|
|
|
|
|
1.000
1.000 | 1.000 |