 20
20peptides
spectra
0.000 | 0.000
0.000 | 0.000
0.000 | 0.000
0.049 | 0.064
0.000 | 0.006
0.000 | 0.000
0.899 | 0.911
0.029 | 0.040
| Plot | Mito | Lyso | Perox | ER | Golgi | PM | Cytosol | Nucleus | |||||
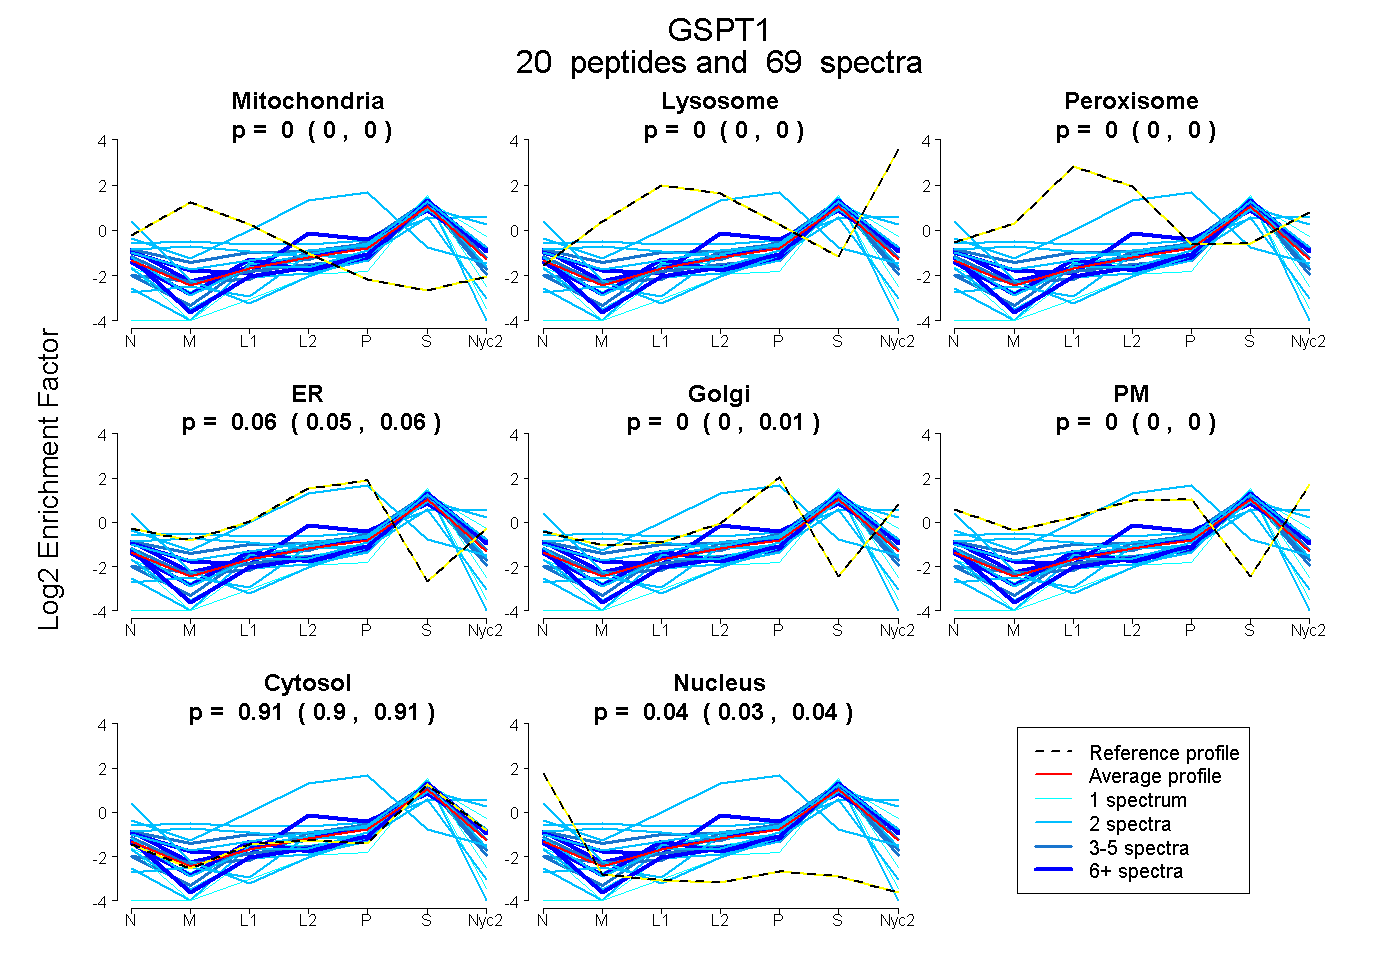
| Expt A |
20 peptides |
69 spectra |
|
0.000 0.000 | 0.000 |
0.000 0.000 | 0.000 |
0.000 0.000 | 0.000 |
0.059 0.049 | 0.064 |
0.000 0.000 | 0.006 |
0.000 0.000 | 0.000 |
0.905 0.899 | 0.911 |
0.035 0.029 | 0.040 |
| 5 spectra, DMGTVVLGK | 0.000 | 0.000 | 0.000 | 0.004 | 0.000 | 0.000 | 0.996 | 0.000 | ||
| 4 spectra, HFTILDAPGHK | 0.000 | 0.000 | 0.000 | 0.034 | 0.000 | 0.000 | 0.945 | 0.021 | ||
| 2 spectra, VGFNPK | 0.000 | 0.000 | 0.000 | 0.000 | 0.023 | 0.000 | 0.956 | 0.020 | ||
| 2 spectra, MDDPTVNWSNER | 0.000 | 0.000 | 0.000 | 0.000 | 0.000 | 0.000 | 0.925 | 0.075 | ||
| 2 spectra, TAGTICLETFK | 0.000 | 0.104 | 0.000 | 0.000 | 0.052 | 0.068 | 0.776 | 0.000 | ||
| 1 spectrum, LPIVDK | 0.000 | 0.000 | 0.000 | 0.000 | 0.000 | 0.000 | 1.000 | 0.000 | ||
| 10 spectra, TVEVGR | 0.000 | 0.000 | 0.000 | 0.000 | 0.000 | 0.000 | 0.951 | 0.049 | ||
| 1 spectrum, GIEEEEILPGFILCDLNNLCHSGR | 0.000 | 0.000 | 0.000 | 0.000 | 0.000 | 0.000 | 0.788 | 0.212 | ||
| 2 spectra, EHVNVVFIGHVDAGK | 0.000 | 0.000 | 0.000 | 0.000 | 0.000 | 0.000 | 0.895 | 0.105 | ||
| 2 spectra, DIHFMPCSGLTGANLK | 0.072 | 0.207 | 0.000 | 0.000 | 0.000 | 0.163 | 0.558 | 0.000 | ||
| 5 spectra, GQQLVMMPNK | 0.060 | 0.000 | 0.087 | 0.000 | 0.122 | 0.000 | 0.731 | 0.000 | ||
| 6 spectra, SVDGPIR | 0.000 | 0.000 | 0.000 | 0.000 | 0.000 | 0.000 | 0.990 | 0.010 | ||
| 1 spectrum, AYFETEK | 0.000 | 0.028 | 0.000 | 0.000 | 0.000 | 0.000 | 0.972 | 0.000 | ||
| 3 spectra, LIPFLK | 0.000 | 0.000 | 0.000 | 0.000 | 0.000 | 0.000 | 0.932 | 0.068 | ||
| 2 spectra, TFDAQIVIIEHK | 0.000 | 0.000 | 0.000 | 0.000 | 0.017 | 0.000 | 0.983 | 0.000 | ||
| 7 spectra, EHAMLAK | 0.000 | 0.000 | 0.000 | 0.000 | 0.122 | 0.000 | 0.853 | 0.025 | ||
| 8 spectra, HLIVLINK | 0.000 | 0.000 | 0.000 | 0.222 | 0.000 | 0.000 | 0.778 | 0.000 | ||
| 2 spectra, SVVAPPGAPK | 0.000 | 0.000 | 0.000 | 0.000 | 0.000 | 0.000 | 0.565 | 0.435 | ||
| 2 spectra, LVPEK | 0.000 | 0.000 | 0.013 | 0.734 | 0.000 | 0.000 | 0.253 | 0.000 | ||
| 2 spectra, LESGSICK | 0.202 | 0.047 | 0.048 | 0.000 | 0.000 | 0.000 | 0.703 | 0.000 |
| Plot | Mito | Lyso or Perox | ER | Golgi | PM | Cytosol | Nucleus | ||||||
| Expt B |
5 peptides |
13 spectra |
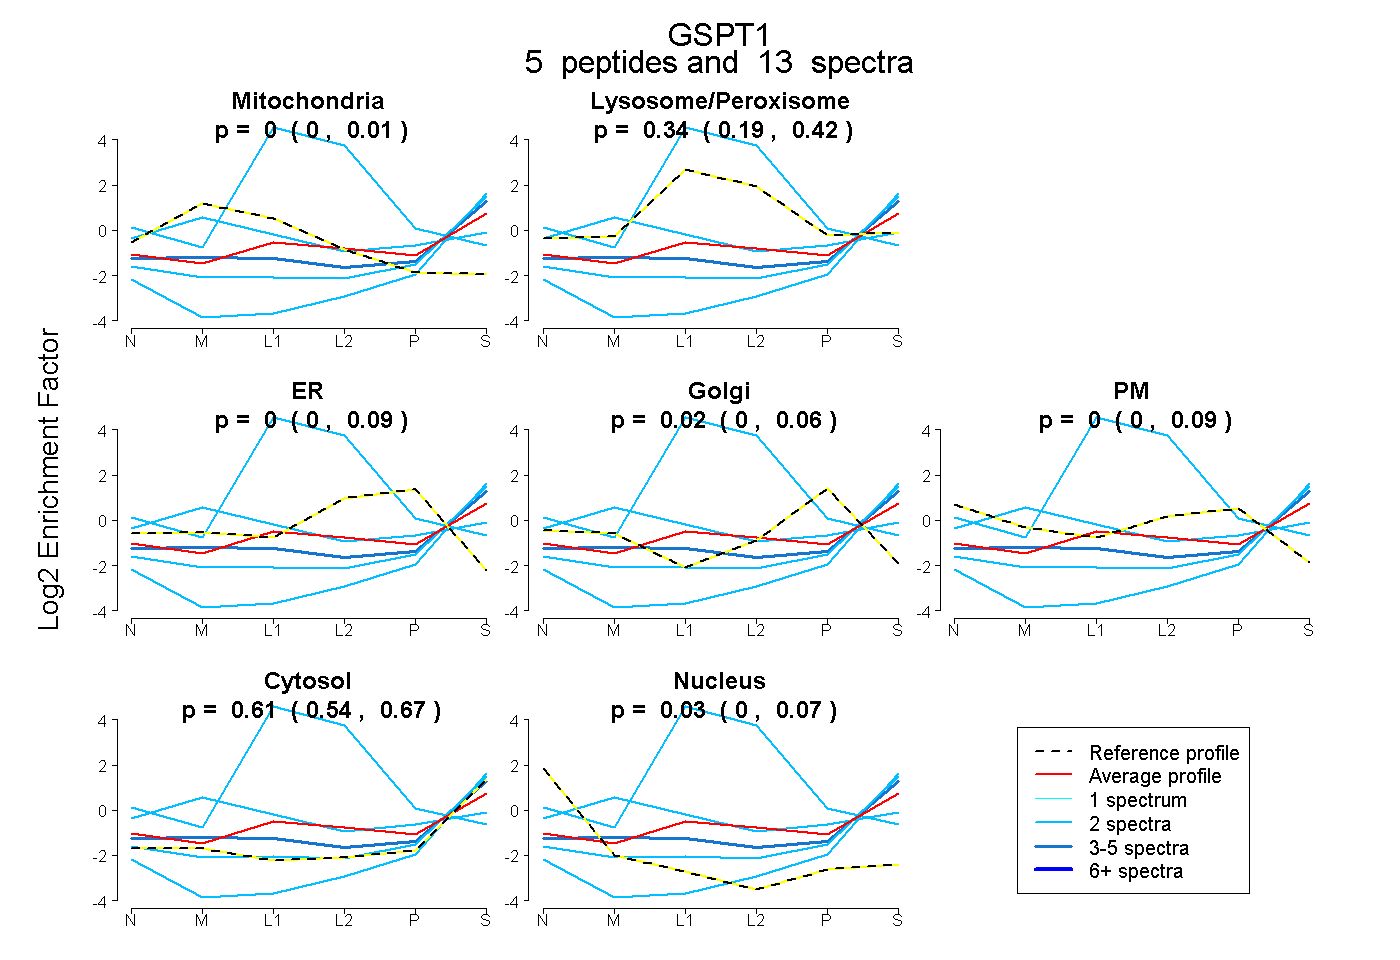 |
0.000 0.000 | 0.010 |
0.337 0.186 | 0.416 |
0.000 0.000 | 0.091 |
0.017 0.000 | 0.057 |
0.000 0.000 | 0.091 |
0.611 0.535 | 0.672 |
0.034 0.000 | 0.073 |
|||
| Plot | Lyso | Other | |||||||||||
| Expt C |
13 peptides |
66 spectra |
 |
0.002 0.000 | 0.996 |
0.998 0.004 | 1.000 |
||||||||
| Plot | Lyso | Other | |||||||||||
| Expt D |
3 peptides |
4 spectra |
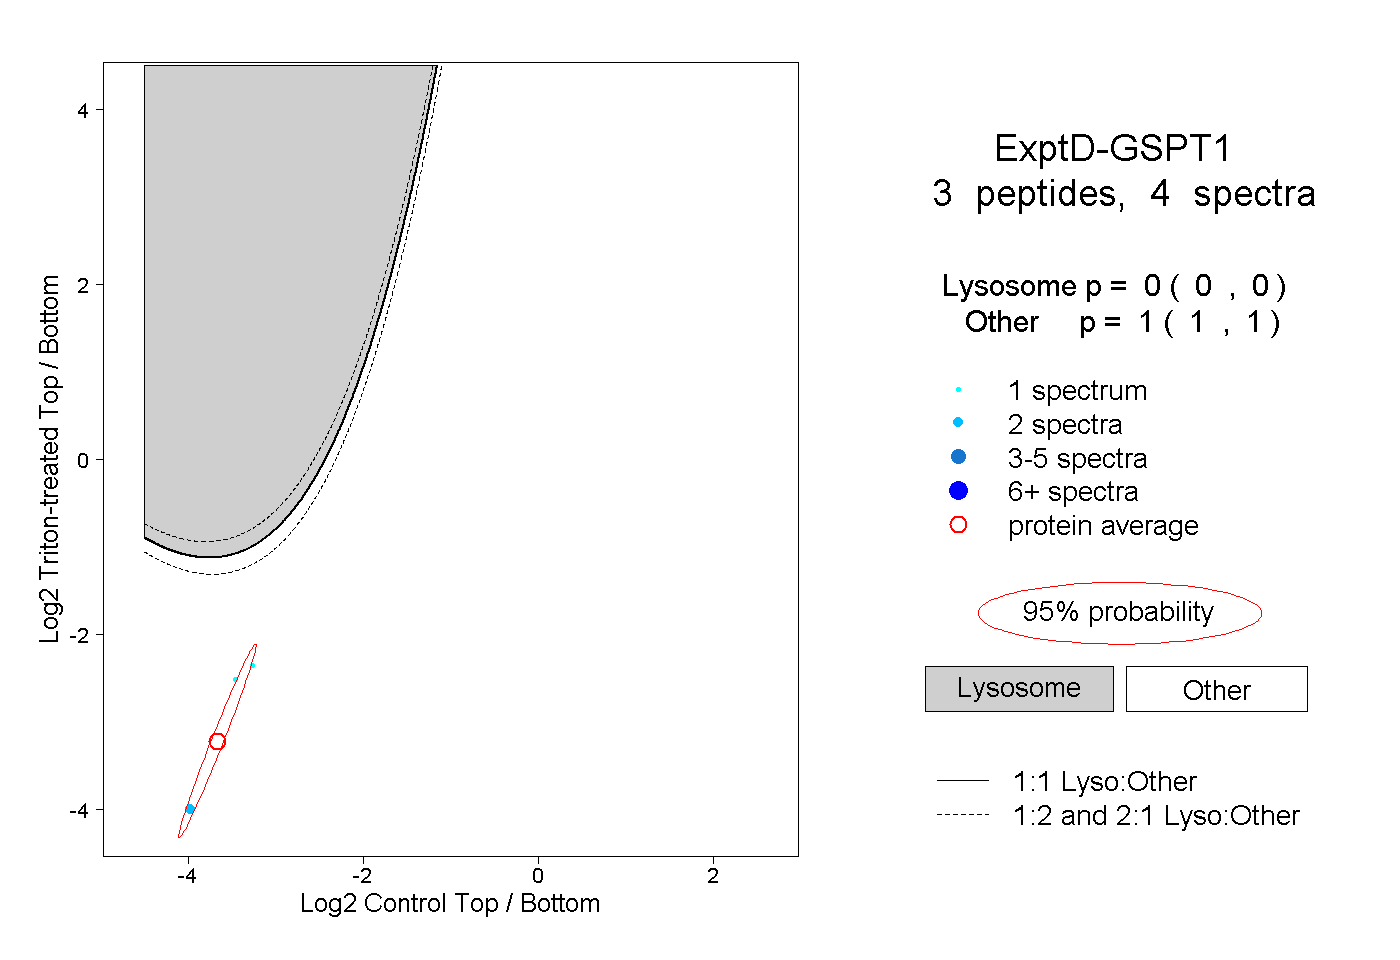 |
0.000 0.000 | 0.000 |
1.000 1.000 | 1.000 |