 13
13peptides
spectra
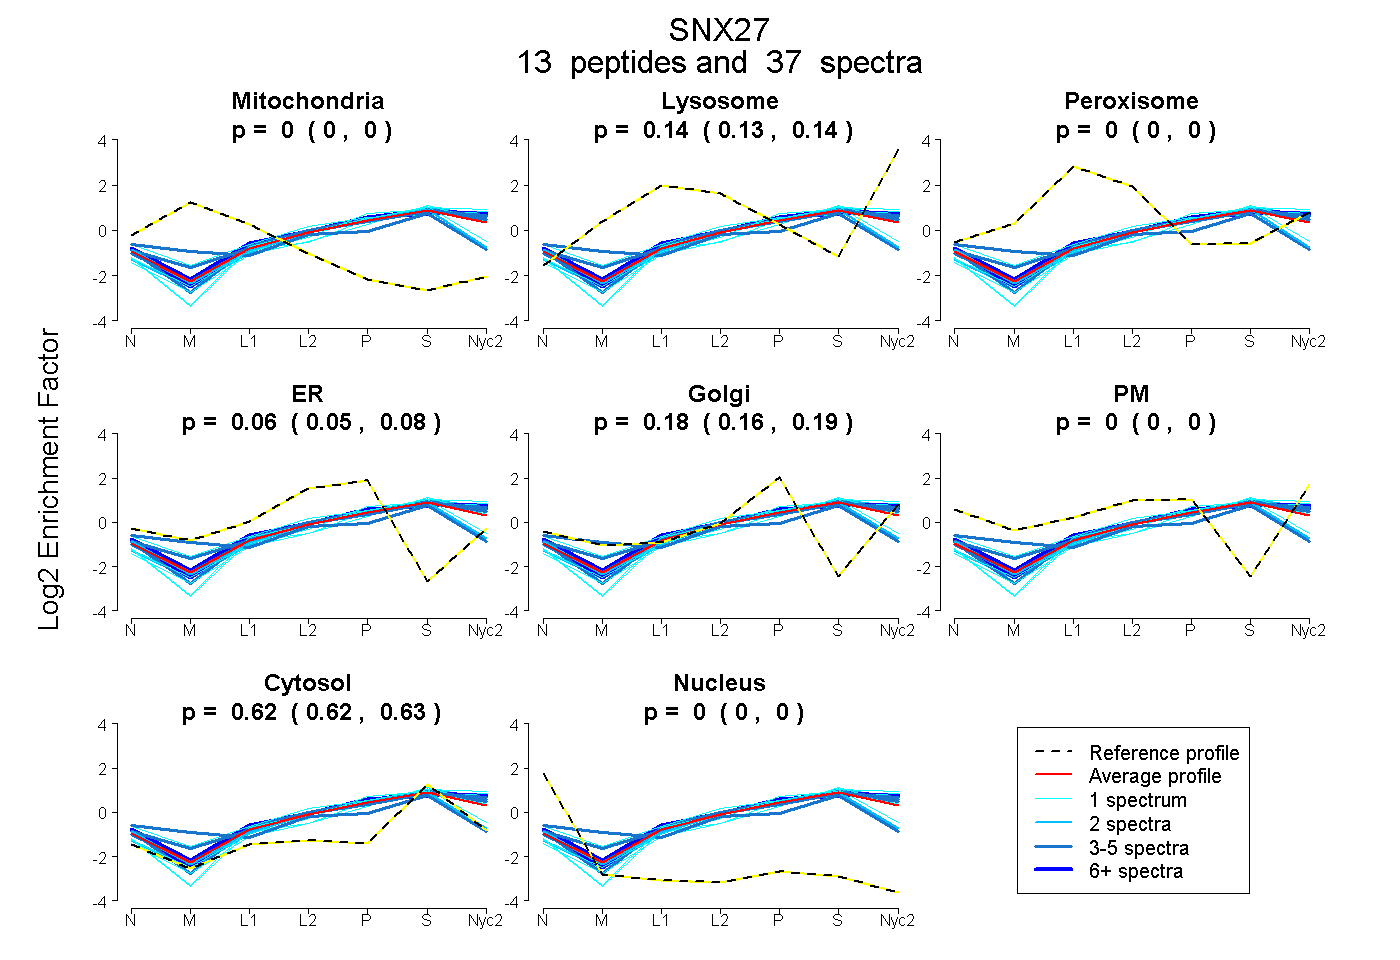
0.000 | 0.000
0.127 | 0.143
0.000 | 0.000
0.047 | 0.079
0.161 | 0.188
0.000 | 0.000
0.619 | 0.628
0.000 | 0.000
6peptides
spectra
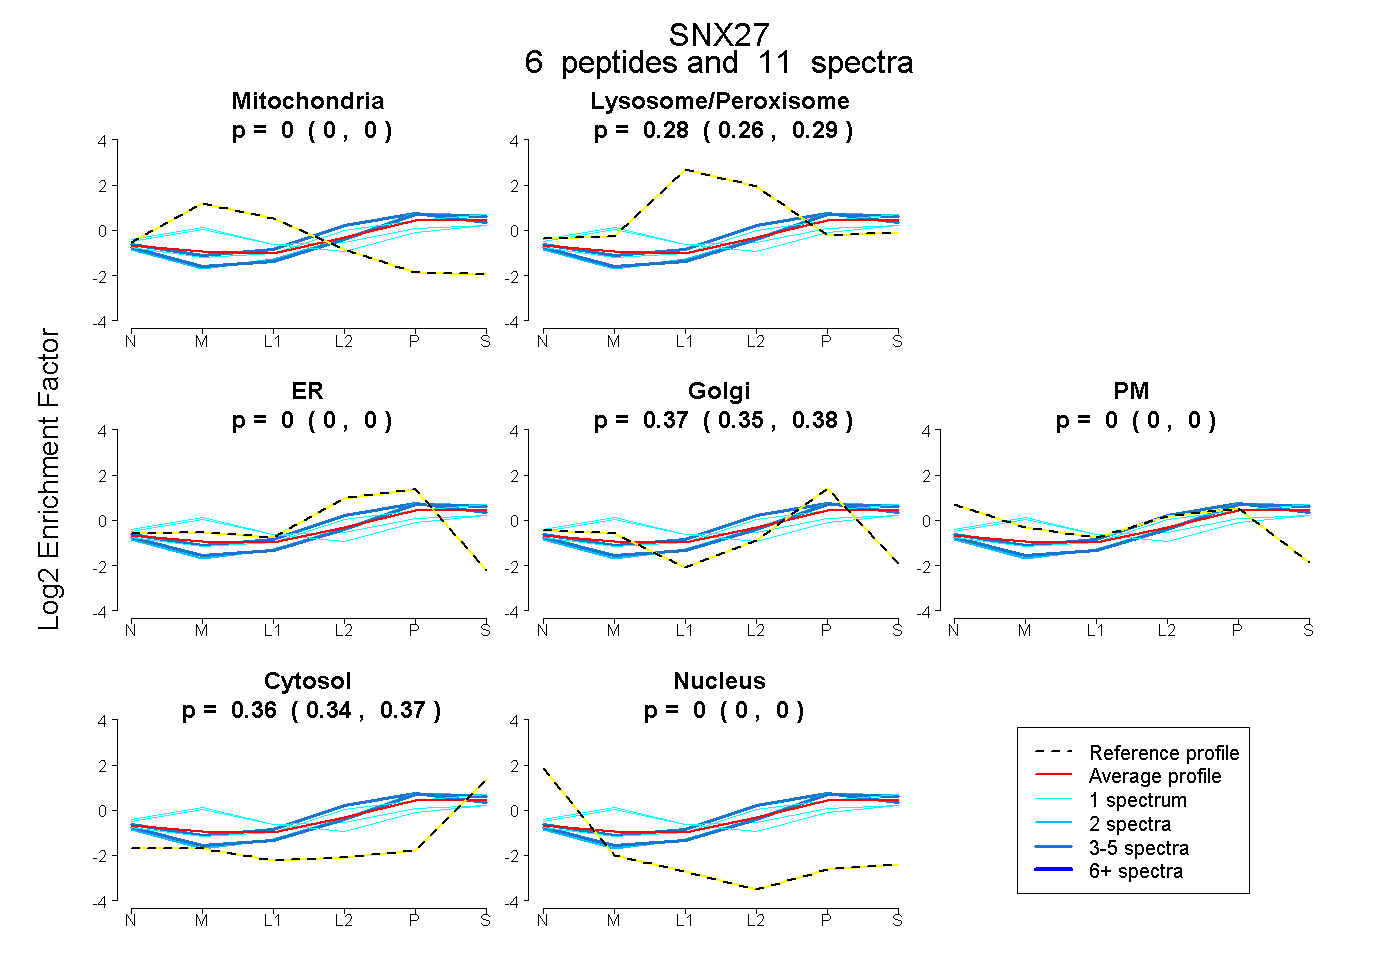
0.000 | 0.000
0.260 | 0.288
0.000 | 0.000
0.349 | 0.382
0.000 | 0.000
0.340 | 0.371
0.000 | 0.000
15peptides
spectra
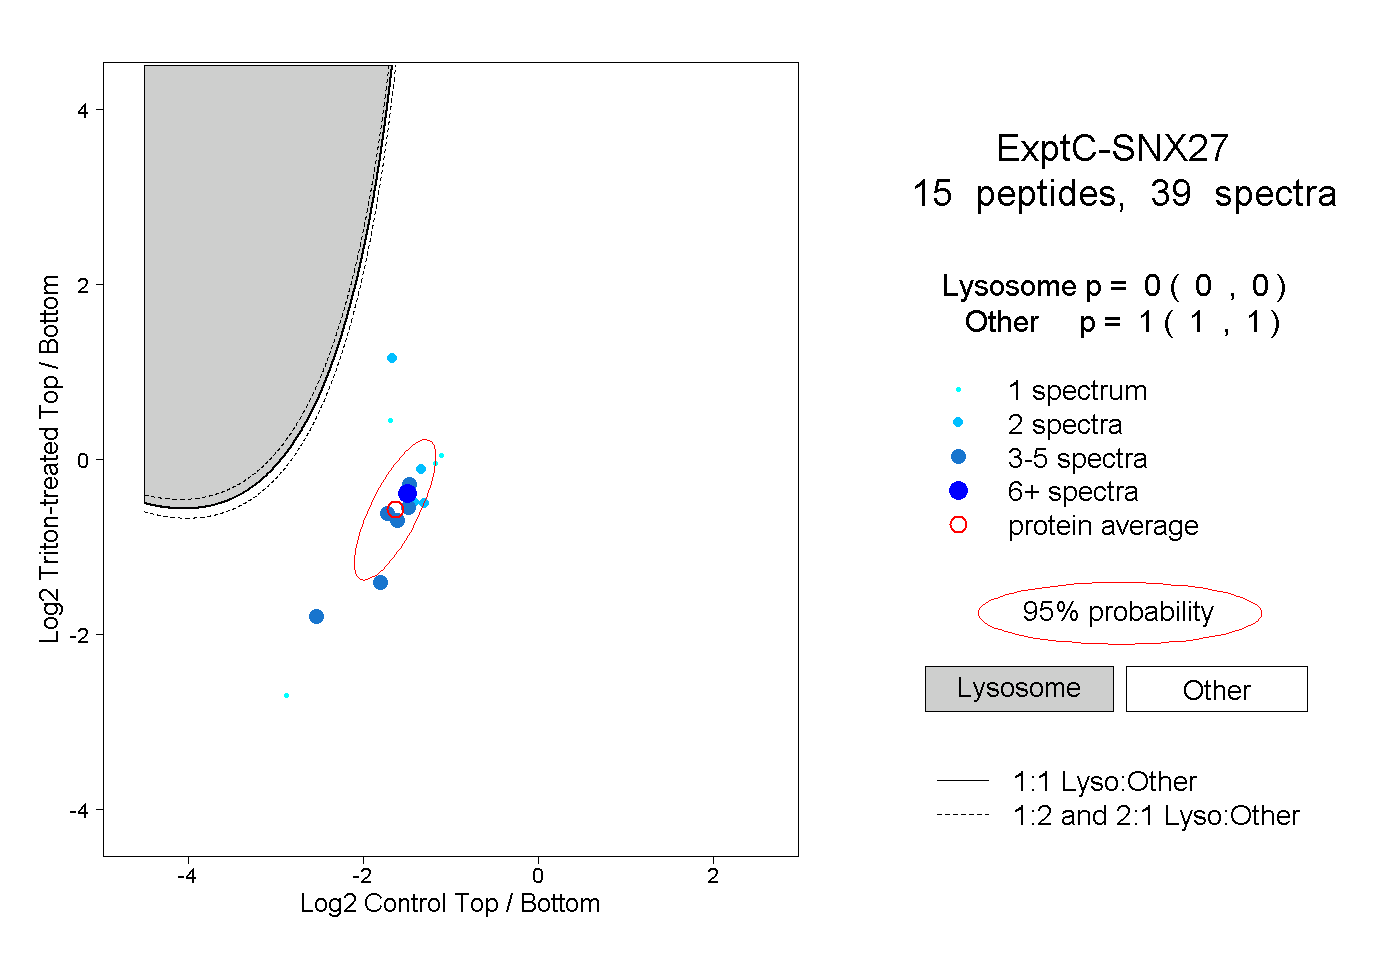
0.000 | 0.000
1.000 | 1.000
7peptides
spectra
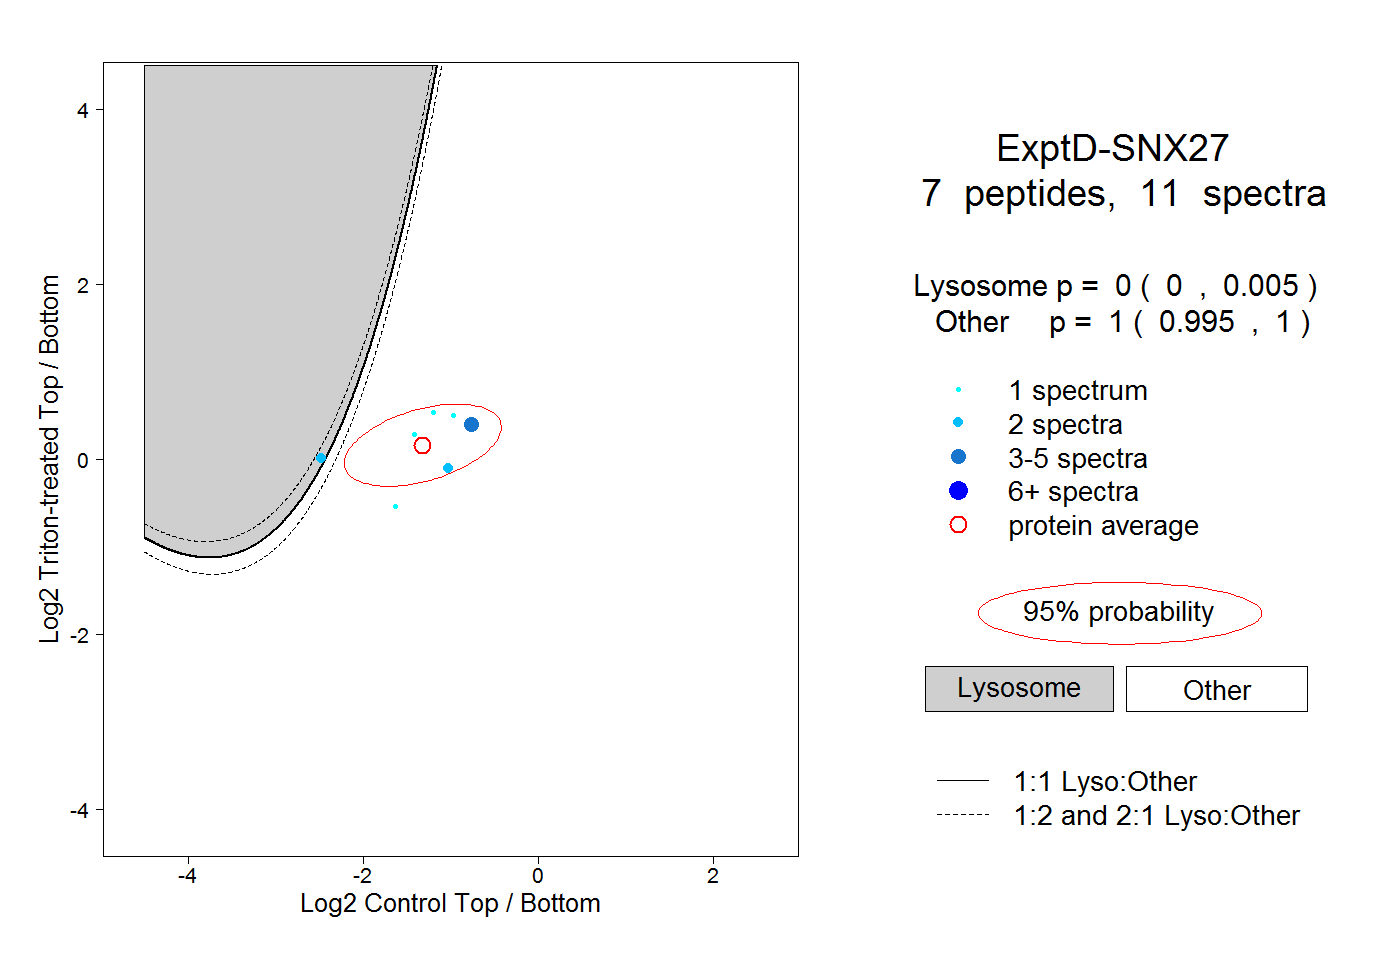
0.000 | 0.005
0.995 | 1.000