SNX27
[ENSRNOP00000067026]
Main page
| | | Plot |
Mito |
Lyso |
|
Perox |
ER |
Golgi |
PM |
Cytosol |
Nucleus |
|
| Expt A |
 13
13
peptides |
37
spectra |
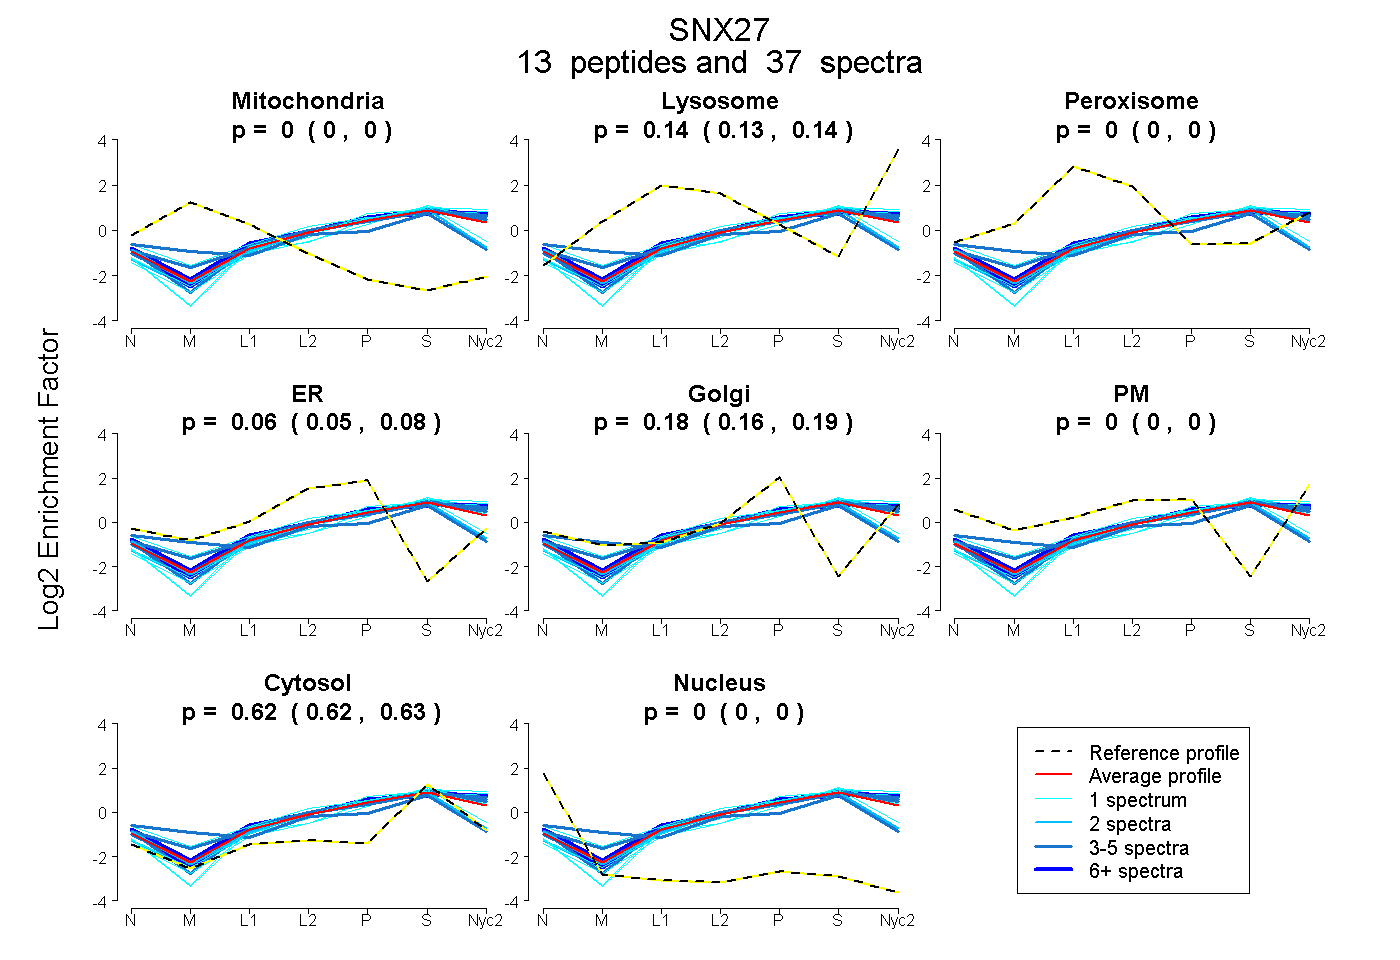 |
0.000
0.000 | 0.000 |
0.136
0.127 | 0.143 |
|
0.000
0.000 | 0.000 |
0.064
0.047 | 0.079 |
0.176
0.161 | 0.188 |
0.000
0.000 | 0.000 |
0.624
0.619 | 0.628 |
0.000
0.000 | 0.000 |
|
| | | Plot |
Mito |
|
Lyso or Perox |
|
ER |
Golgi |
PM |
Cytosol |
Nucleus |
|
| Expt B |
6
peptides |
11
spectra |
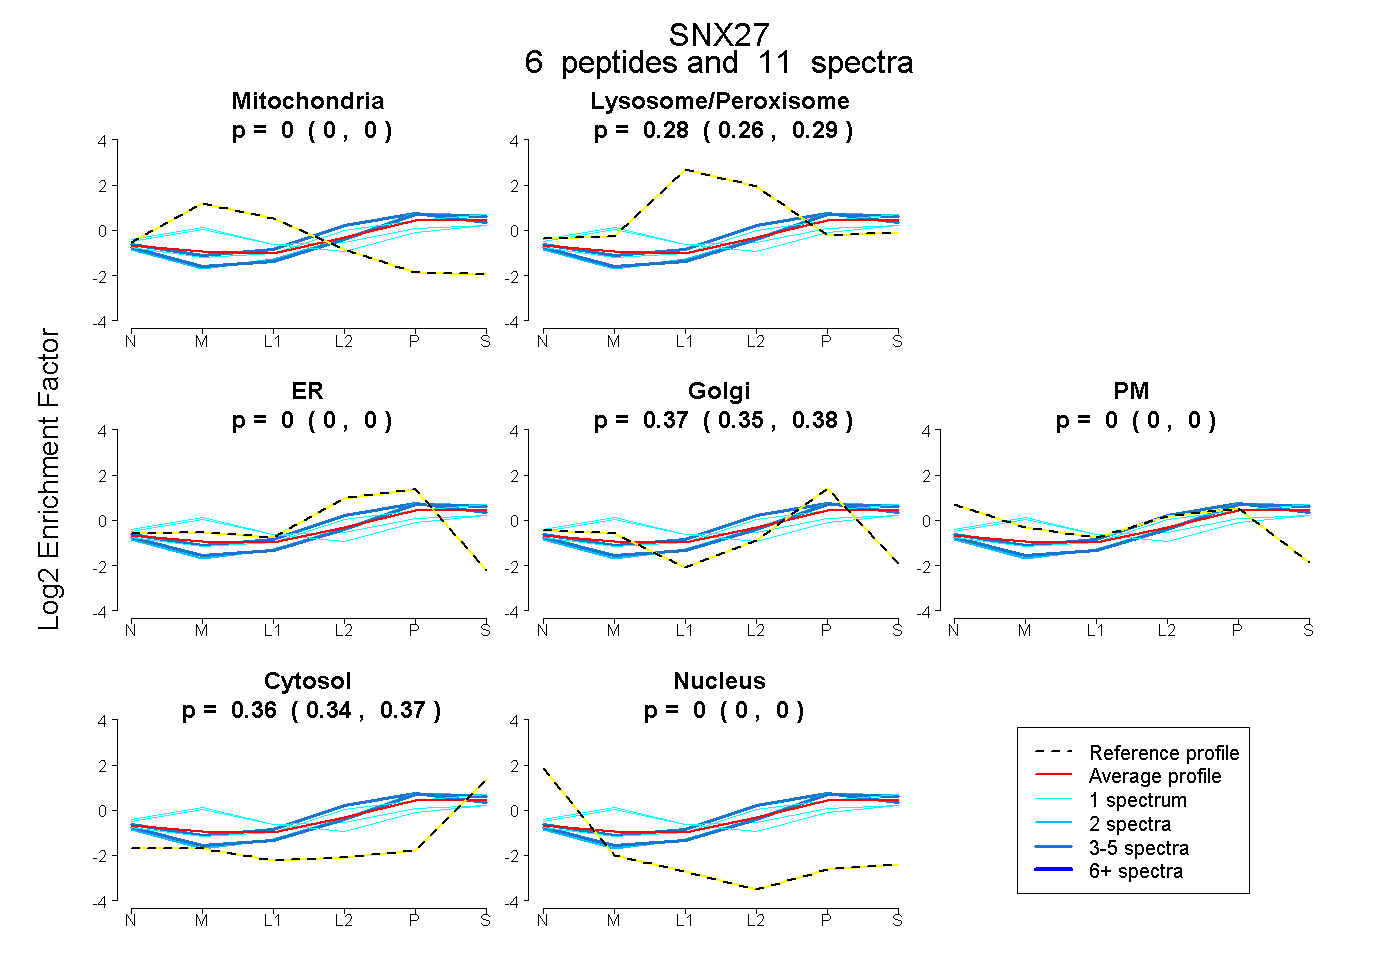 |
0.000
0.000 | 0.000 |
|
0.276
0.260 | 0.288 |
|
0.000
0.000 | 0.000 |
0.367
0.349 | 0.382 |
0.000
0.000 | 0.000 |
0.357
0.340 | 0.371 |
0.000
0.000 | 0.000 |
|
| 1 spectrum, VFCELK |
0.000 |
|
0.250 |
|
0.170 |
0.163 |
0.000 |
0.417 |
0.000 |
|
| 1 spectrum, VALPDGATVTVR |
0.141 |
|
0.217 |
|
0.000 |
0.255 |
0.061 |
0.326 |
0.000 |
|
| 1 spectrum, QAVPISVPTYK |
0.059 |
|
0.293 |
|
0.000 |
0.316 |
0.031 |
0.300 |
0.000 |
|
| 3 spectra, GLEEYLEK |
0.000 |
|
0.264 |
|
0.190 |
0.240 |
0.000 |
0.306 |
0.000 |
|
| 3 spectra, QVVDLIR |
0.000 |
|
0.172 |
|
0.106 |
0.301 |
0.000 |
0.421 |
0.000 |
|
| 2 spectra, GQVSEGGQLR |
0.000 |
|
0.157 |
|
0.182 |
0.222 |
0.000 |
0.440 |
0.000 |
|
| | | Plot |
|
Lyso |
|
|
|
|
|
|
|
Other |
| Expt C |
15
peptides |
39
spectra |
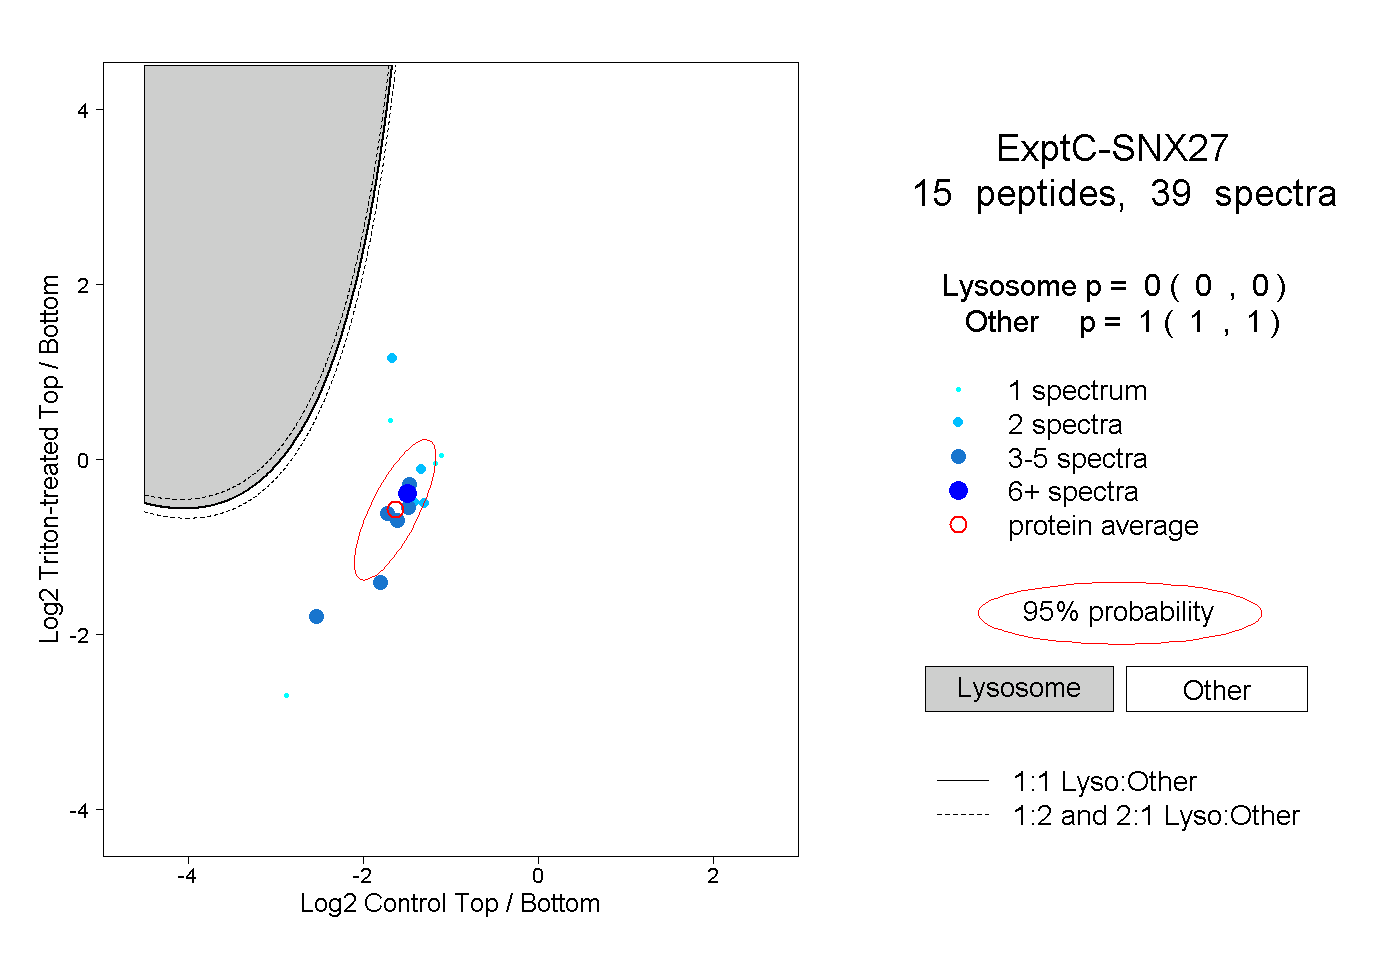 |
|
0.000
0.000 | 0.000 |
|
|
|
|
|
|
|
1.000
1.000 | 1.000 |
| | | Plot |
|
Lyso |
|
|
|
|
|
|
|
Other |
| Expt D |
7
peptides |
11
spectra |
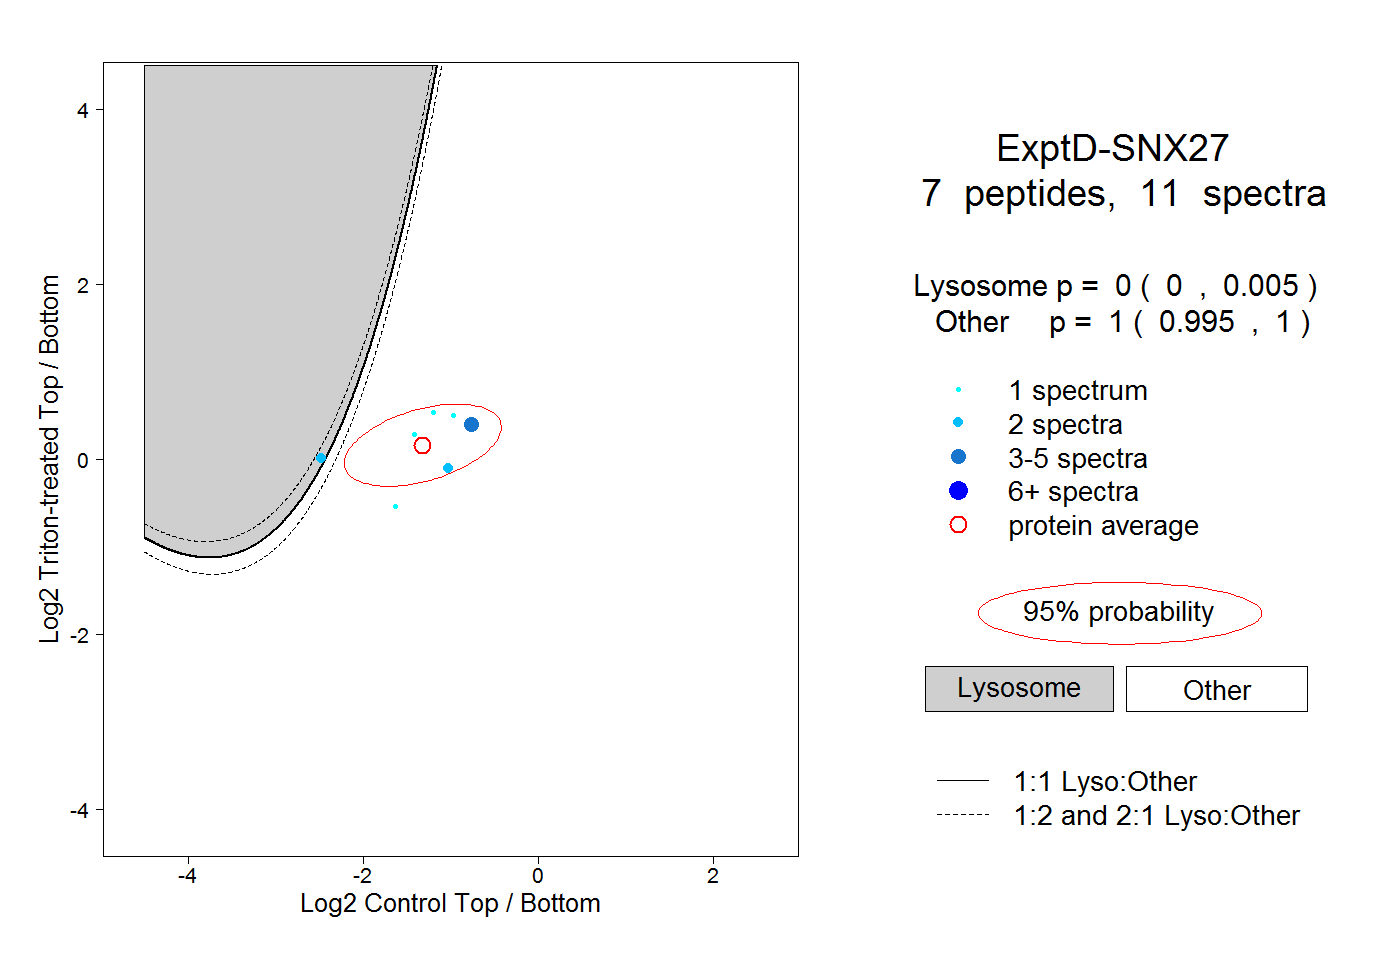 |
|
0.000
0.000 | 0.005 |
|
|
|
|
|
|
|
1.000
0.995 | 1.000 |