 13
13peptides
spectra
0.000 | 0.000
0.127 | 0.143
0.000 | 0.000
0.047 | 0.079
0.161 | 0.188
0.000 | 0.000
0.619 | 0.628
0.000 | 0.000
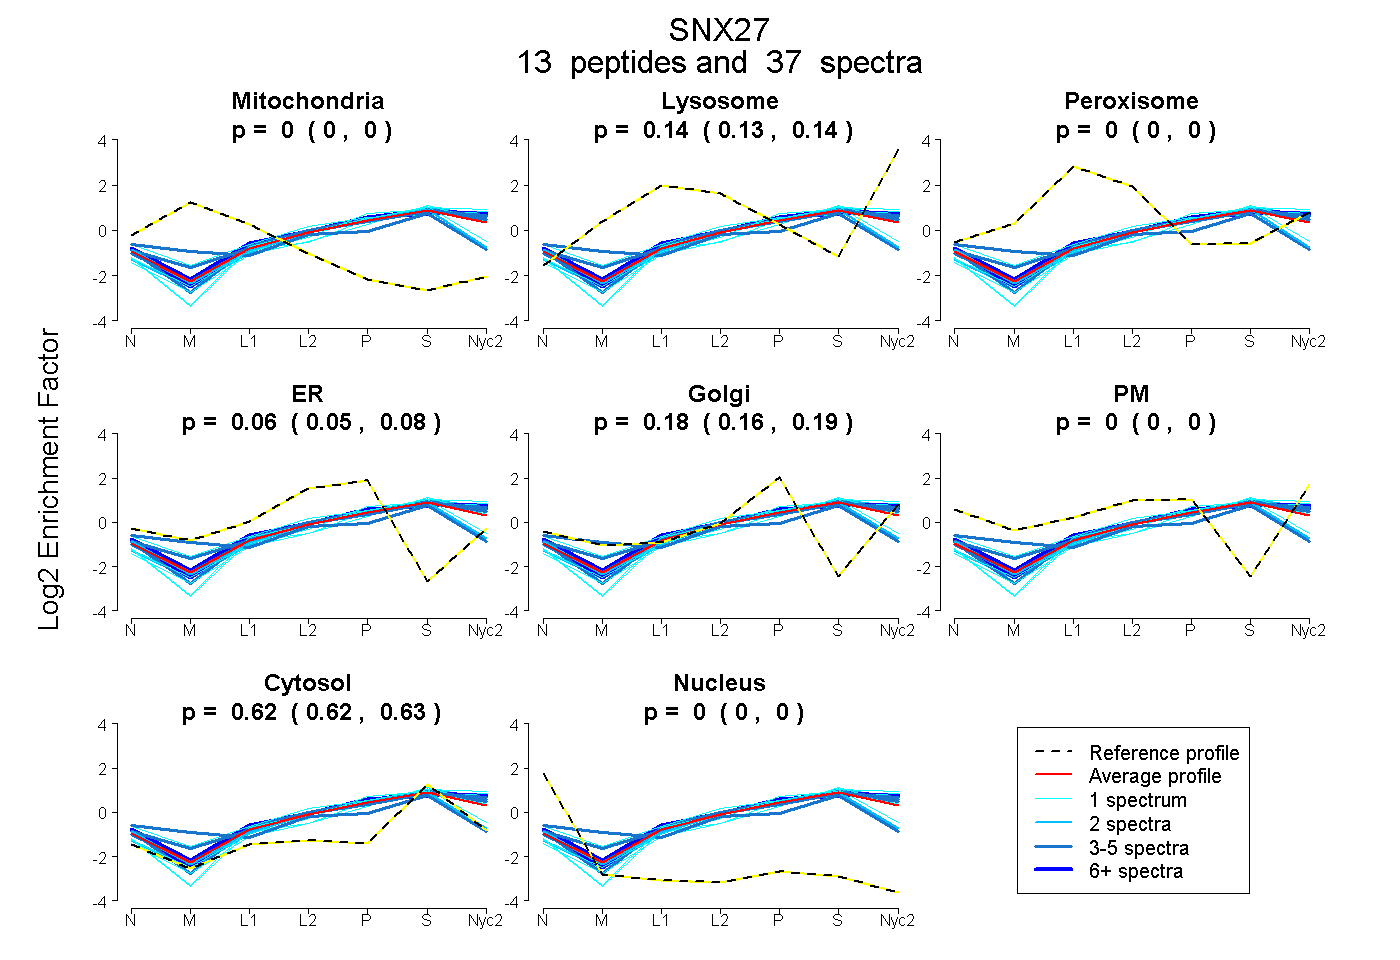
| Plot | Mito | Lyso | Perox | ER | Golgi | PM | Cytosol | Nucleus | |||||
| Expt A |
13 peptides |
37 spectra |
|
0.000 0.000 | 0.000 |
0.136 0.127 | 0.143 |
0.000 0.000 | 0.000 |
0.064 0.047 | 0.079 |
0.176 0.161 | 0.188 |
0.000 0.000 | 0.000 |
0.624 0.619 | 0.628 |
0.000 0.000 | 0.000 |
| 1 spectrum, WPFSLSEQQLDAR | 0.000 | 0.168 | 0.000 | 0.000 | 0.183 | 0.000 | 0.650 | 0.000 | ||
| 6 spectra, FVVYNVYMAGR | 0.000 | 0.200 | 0.000 | 0.000 | 0.244 | 0.000 | 0.556 | 0.000 | ||
| 7 spectra, GLEEYLEK | 0.000 | 0.184 | 0.000 | 0.000 | 0.226 | 0.000 | 0.590 | 0.000 | ||
| 1 spectrum, MVMYLNMLR | 0.000 | 0.100 | 0.000 | 0.000 | 0.177 | 0.000 | 0.723 | 0.000 | ||
| 3 spectra, TCEGYNEIIFPHCACDSR | 0.031 | 0.000 | 0.068 | 0.264 | 0.000 | 0.000 | 0.637 | 0.000 | ||
| 4 spectra, GQVSEGGQLR | 0.000 | 0.153 | 0.000 | 0.008 | 0.214 | 0.000 | 0.625 | 0.000 | ||
| 4 spectra, VALPDGATVTVR | 0.000 | 0.217 | 0.000 | 0.000 | 0.210 | 0.000 | 0.574 | 0.000 | ||
| 1 spectrum, SYQLQK | 0.000 | 0.213 | 0.000 | 0.000 | 0.173 | 0.098 | 0.516 | 0.000 | ||
| 1 spectrum, SESGYGFNVR | 0.000 | 0.099 | 0.000 | 0.000 | 0.274 | 0.000 | 0.627 | 0.000 | ||
| 2 spectra, EFANFTFPR | 0.000 | 0.167 | 0.000 | 0.000 | 0.188 | 0.000 | 0.645 | 0.000 | ||
| 2 spectra, VFCELK | 0.000 | 0.000 | 0.000 | 0.309 | 0.000 | 0.000 | 0.691 | 0.000 | ||
| 1 spectrum, LYVQNYTSAVPGTCLTIR | 0.000 | 0.000 | 0.000 | 0.141 | 0.094 | 0.000 | 0.765 | 0.000 | ||
| 4 spectra, QVVDLIR | 0.000 | 0.159 | 0.000 | 0.015 | 0.217 | 0.000 | 0.609 | 0.000 |
| Plot | Mito | Lyso or Perox | ER | Golgi | PM | Cytosol | Nucleus | ||||||
| Expt B |
6 peptides |
11 spectra |
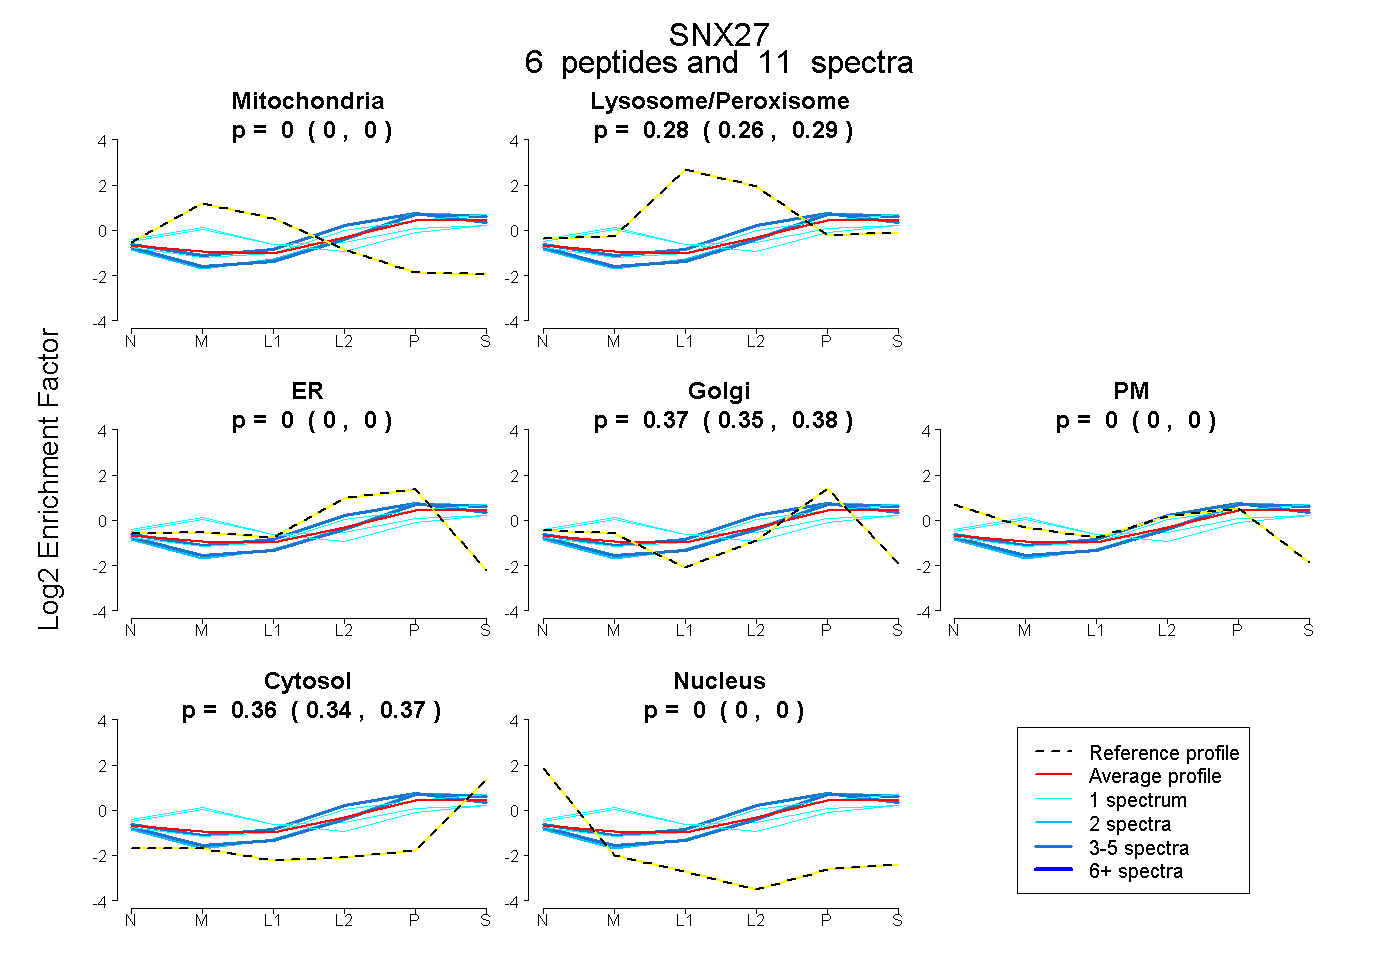 |
0.000 0.000 | 0.000 |
0.276 0.260 | 0.288 |
0.000 0.000 | 0.000 |
0.367 0.349 | 0.382 |
0.000 0.000 | 0.000 |
0.357 0.340 | 0.371 |
0.000 0.000 | 0.000 |
|||
| Plot | Lyso | Other | |||||||||||
| Expt C |
15 peptides |
39 spectra |
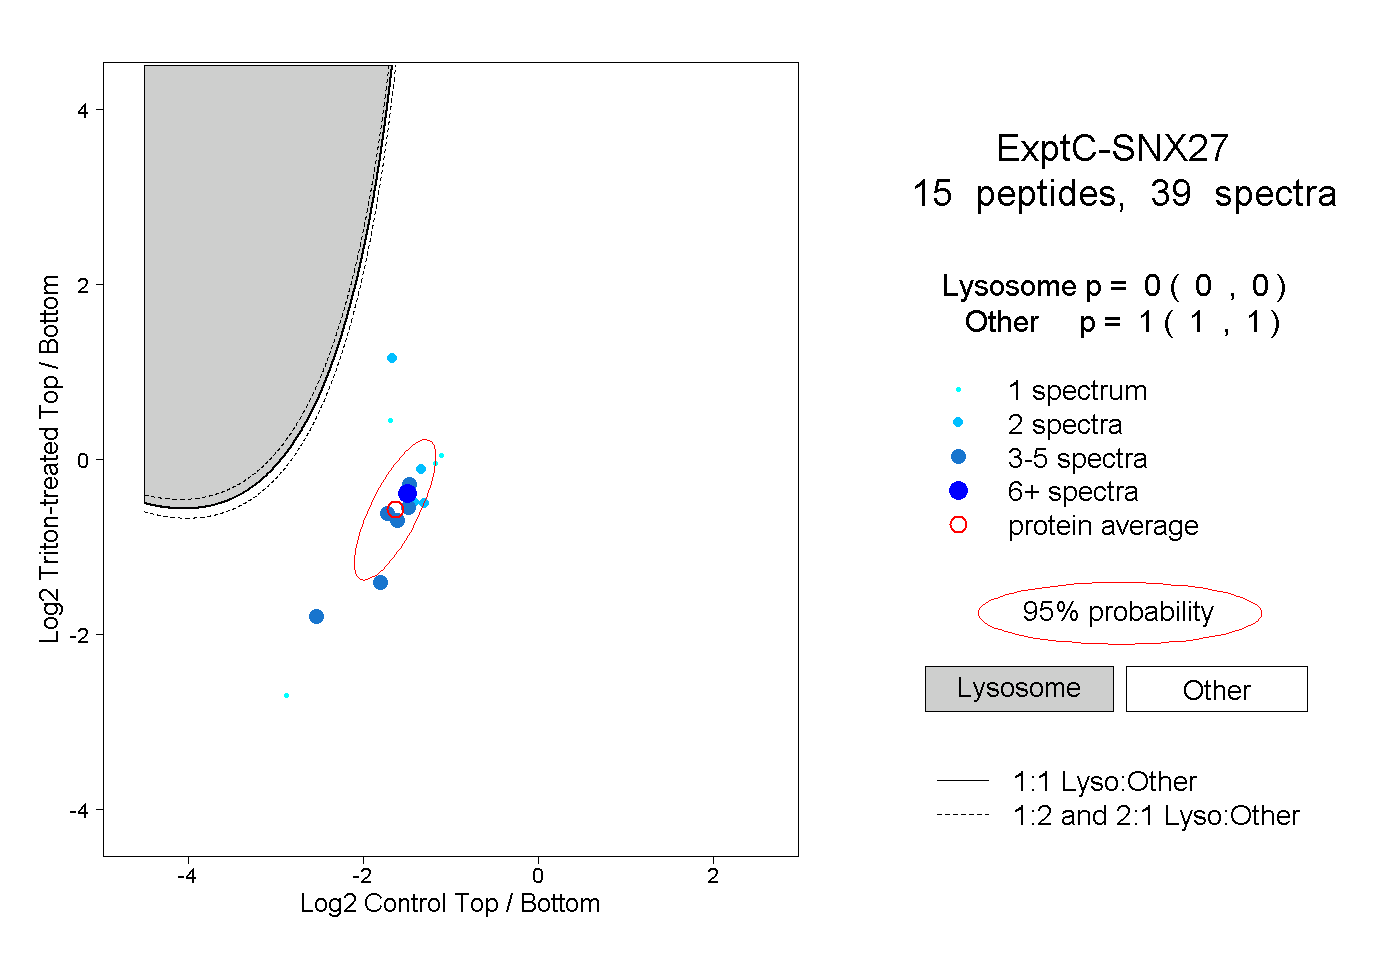 |
0.000 0.000 | 0.000 |
1.000 1.000 | 1.000 |
||||||||
| Plot | Lyso | Other | |||||||||||
| Expt D |
7 peptides |
11 spectra |
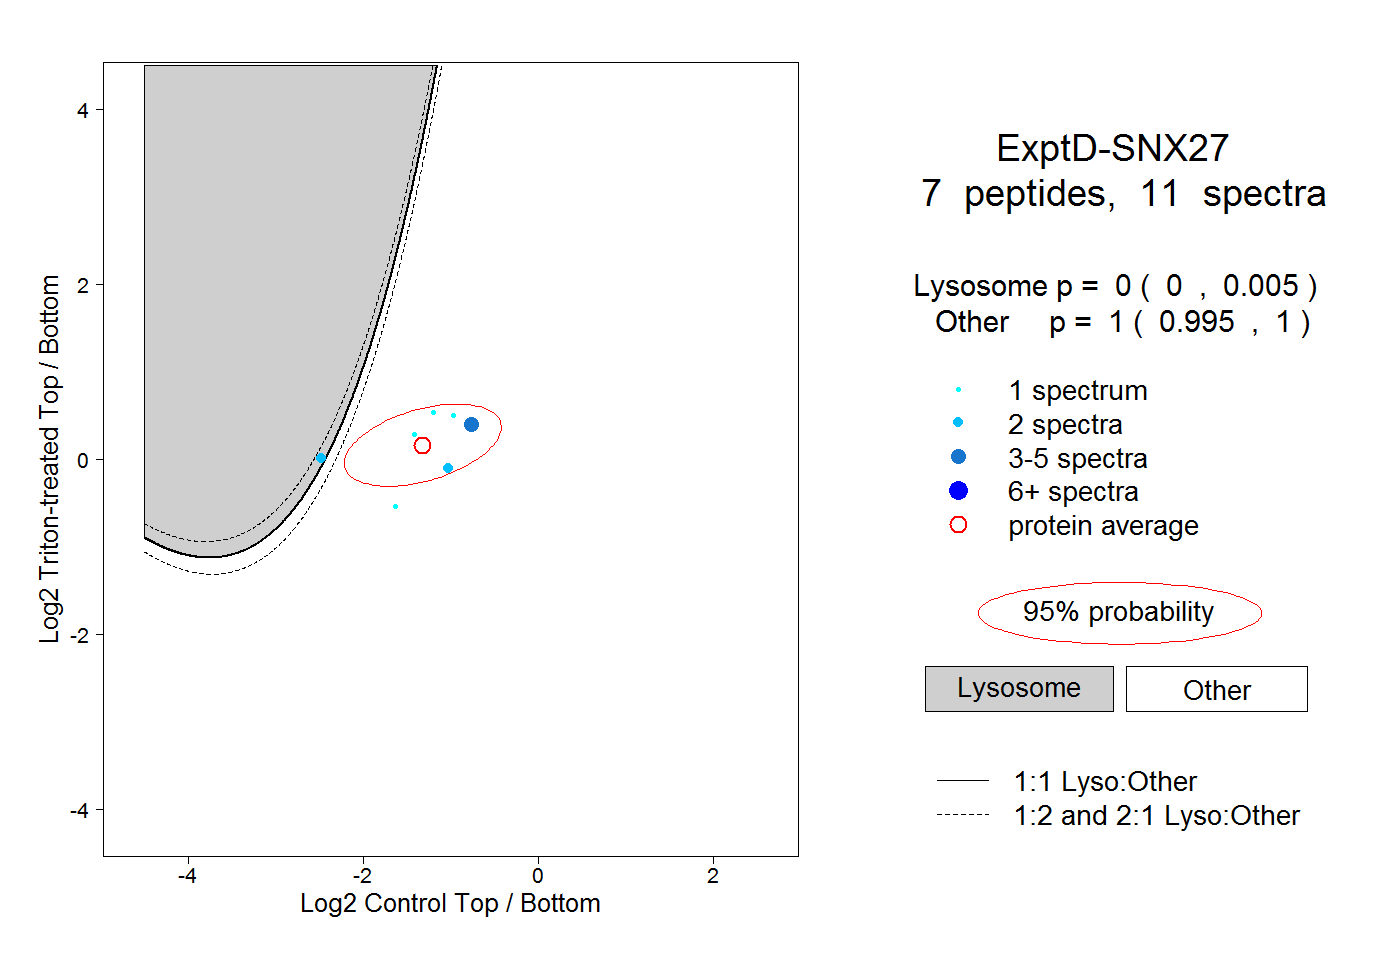 |
0.000 0.000 | 0.005 |
1.000 0.995 | 1.000 |