 12
12peptides
spectra
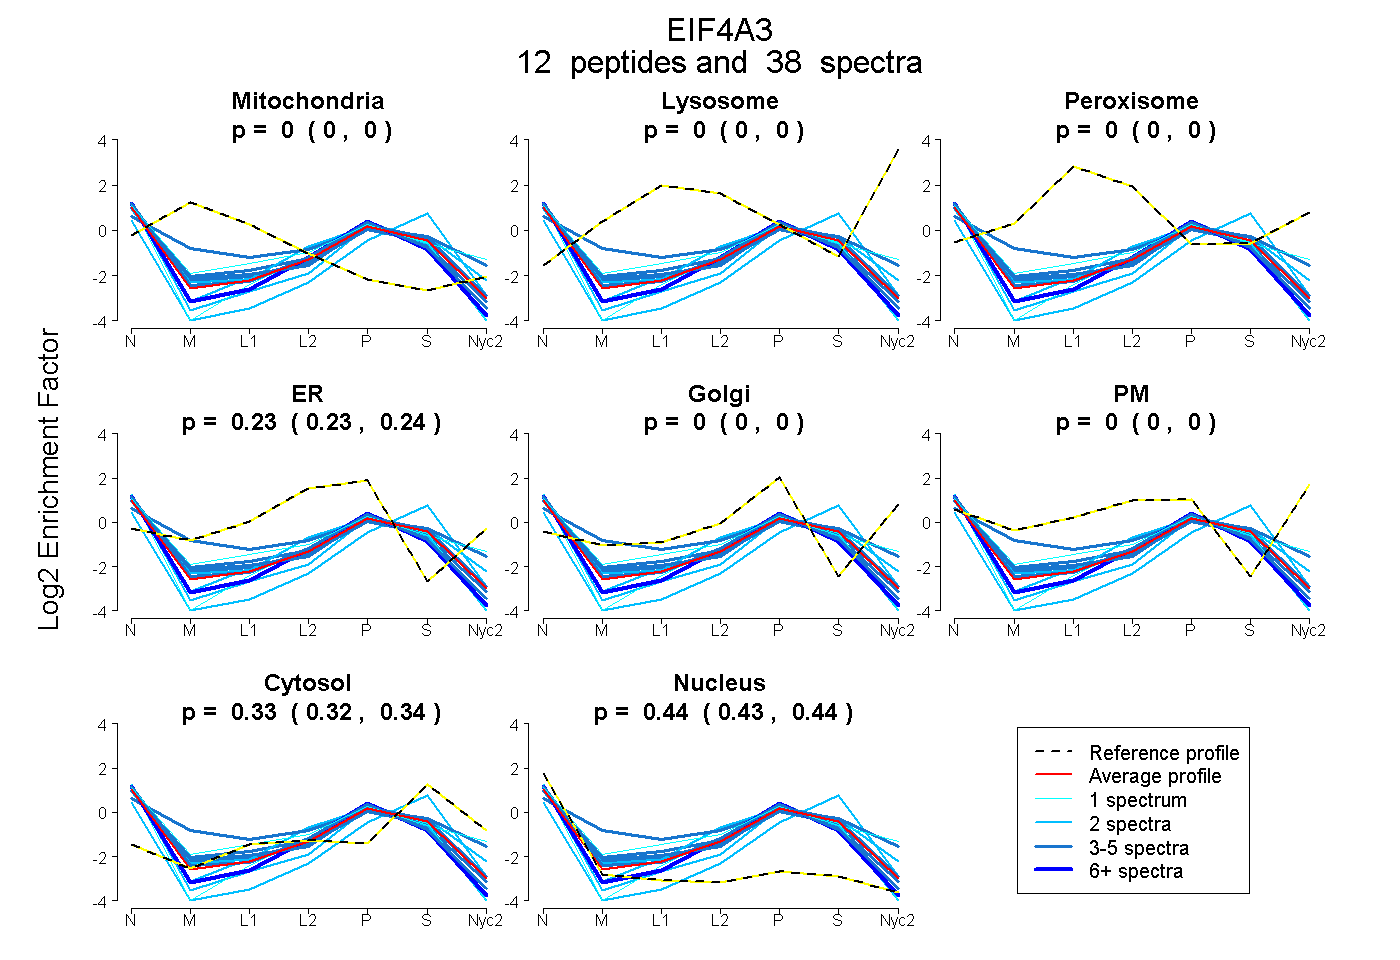
0.000 | 0.000
0.000 | 0.000
0.000 | 0.000
0.226 | 0.238
0.000 | 0.000
0.000 | 0.000
0.323 | 0.338
0.430 | 0.442
5peptides
spectra
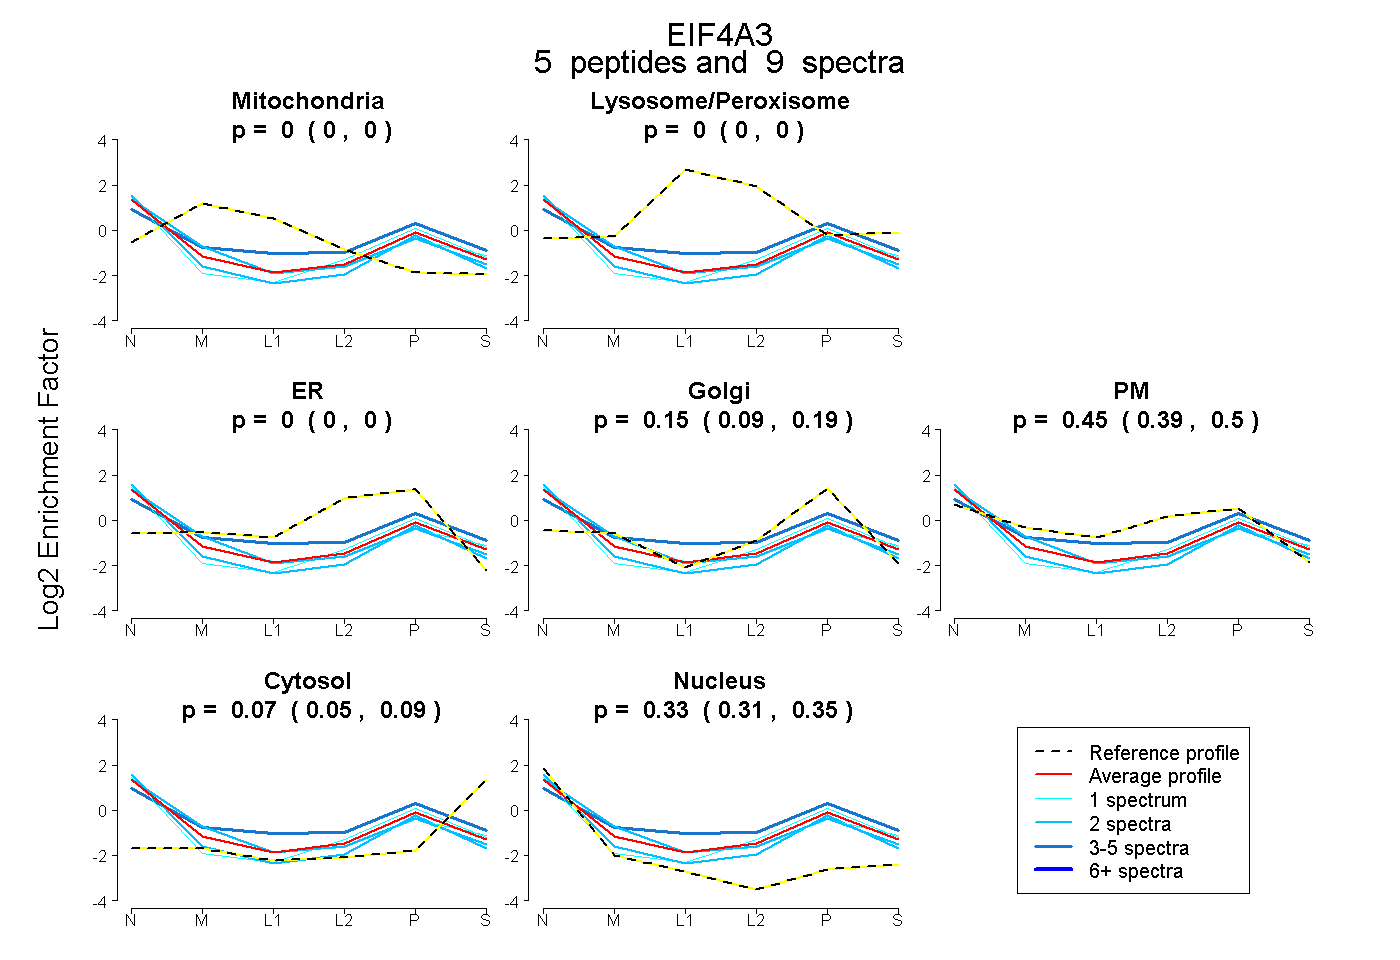
0.000 | 0.000
0.000 | 0.000
0.000 | 0.000
0.086 | 0.194
0.393 | 0.502
0.048 | 0.090
0.311 | 0.350
9peptides
spectra
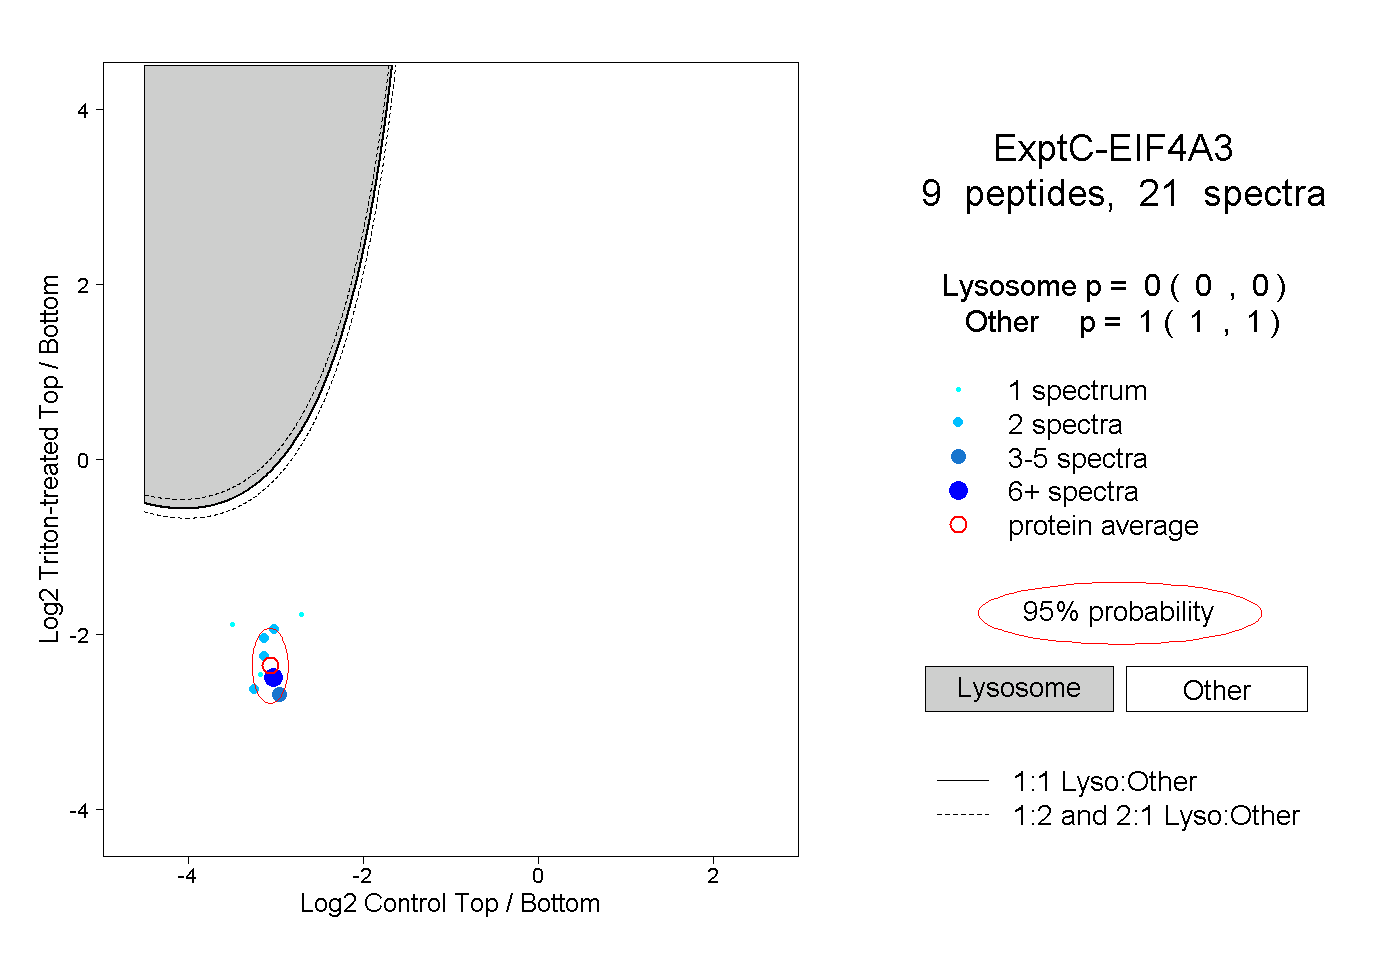
0.000 | 0.000
1.000 | 1.000
1peptide
spectrum
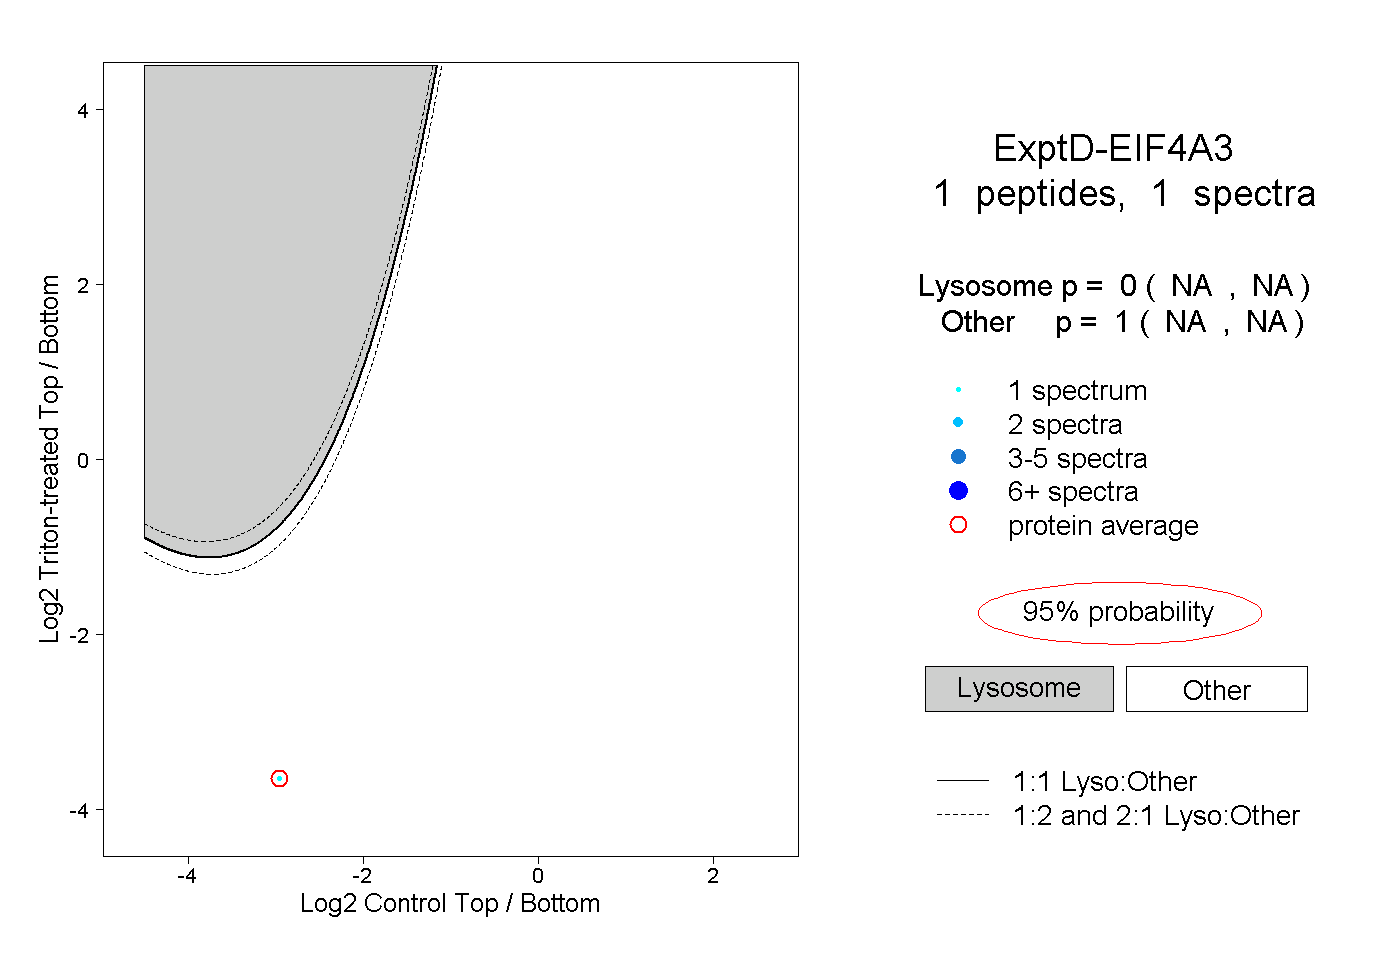
NA | NA
NA | NA