EIF4A3
[ENSRNOP00000066302]
Main page
| | | Plot |
Mito |
Lyso |
|
Perox |
ER |
Golgi |
PM |
Cytosol |
Nucleus |
|
| Expt A |
 12
12
peptides |
38
spectra |
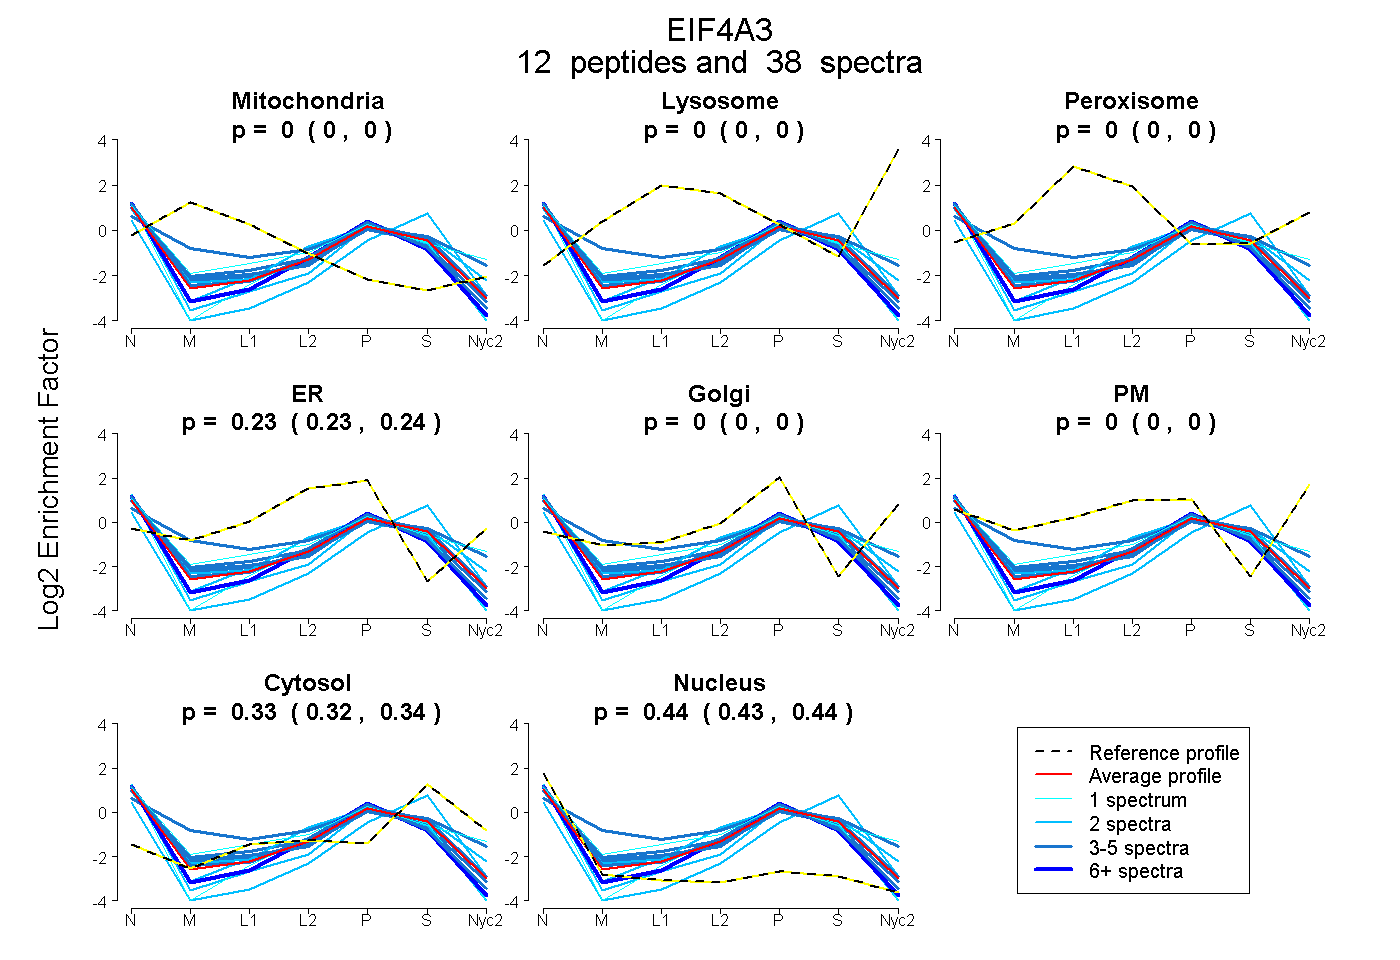 |
0.000
0.000 | 0.000 |
0.000
0.000 | 0.000 |
|
0.000
0.000 | 0.000 |
0.232
0.226 | 0.238 |
0.000
0.000 | 0.000 |
0.000
0.000 | 0.000 |
0.331
0.323 | 0.338 |
0.437
0.430 | 0.442 |
|
| | | Plot |
Mito |
|
Lyso or Perox |
|
ER |
Golgi |
PM |
Cytosol |
Nucleus |
|
| Expt B |
5
peptides |
9
spectra |
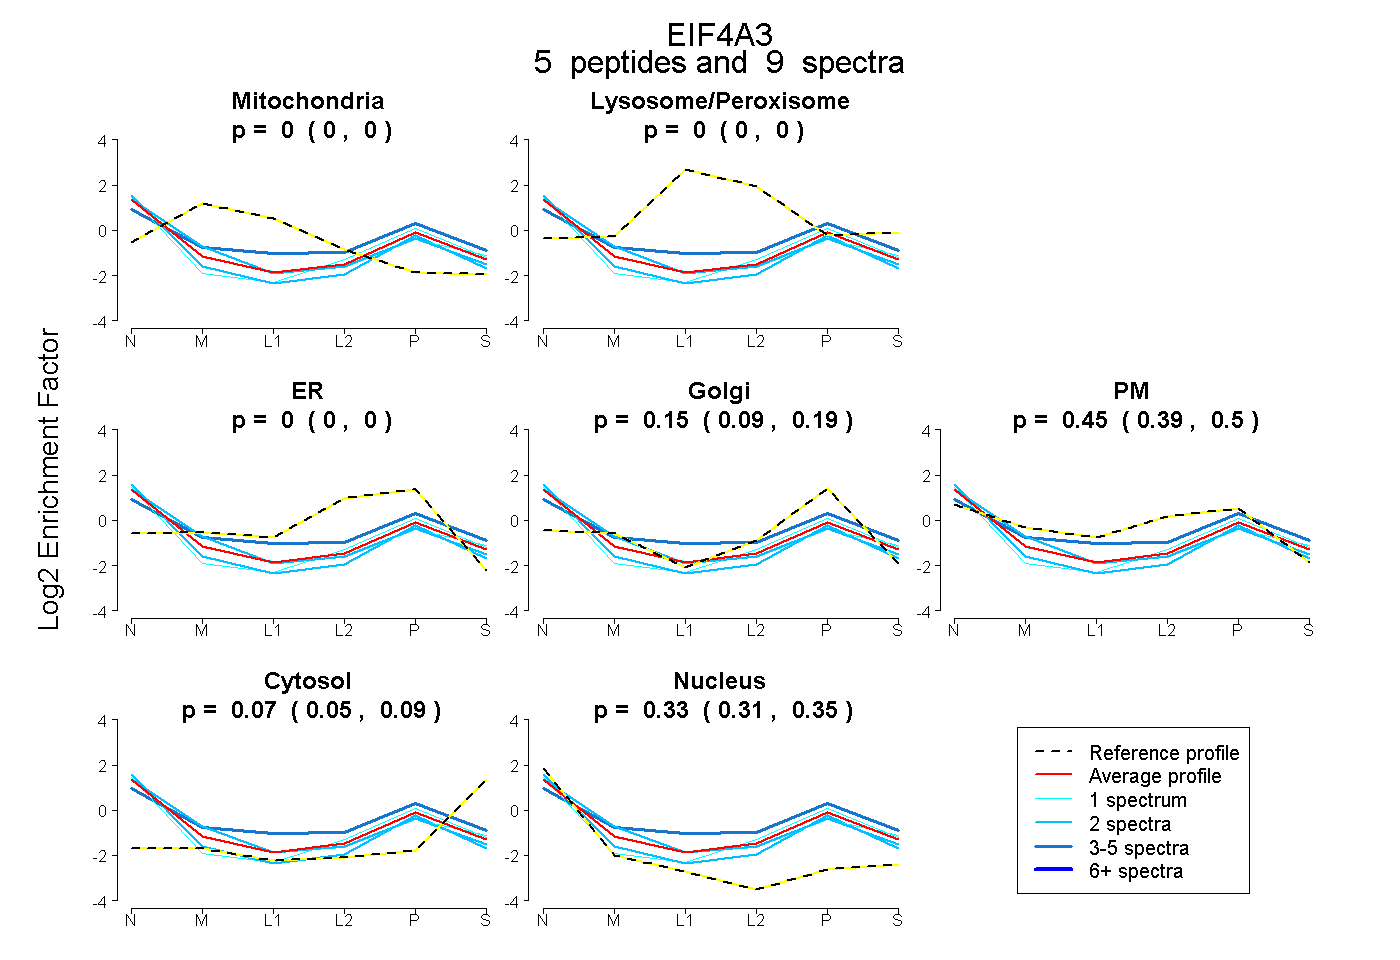 |
0.000
0.000 | 0.000 |
|
0.000
0.000 | 0.000 |
|
0.000
0.000 | 0.000 |
0.149
0.086 | 0.194 |
0.448
0.393 | 0.502 |
0.070
0.048 | 0.090 |
0.333
0.311 | 0.350 |
|
| 2 spectra, ETQALILAPTR |
0.000 |
|
0.000 |
|
0.000 |
0.330 |
0.180 |
0.000 |
0.489 |
|
| 1 spectrum, QFFVAVER |
0.000 |
|
0.000 |
|
0.000 |
0.024 |
0.491 |
0.116 |
0.369 |
|
| 1 spectrum, EQIYDVYR |
0.000 |
|
0.000 |
|
0.000 |
0.270 |
0.312 |
0.069 |
0.349 |
|
| 3 spectra, ELYIHR |
0.000 |
|
0.000 |
|
0.000 |
0.000 |
0.729 |
0.165 |
0.106 |
|
| 2 spectra, VLISTDVWAR |
0.000 |
|
0.000 |
|
0.000 |
0.124 |
0.466 |
0.036 |
0.374 |
|
| | | Plot |
|
Lyso |
|
|
|
|
|
|
|
Other |
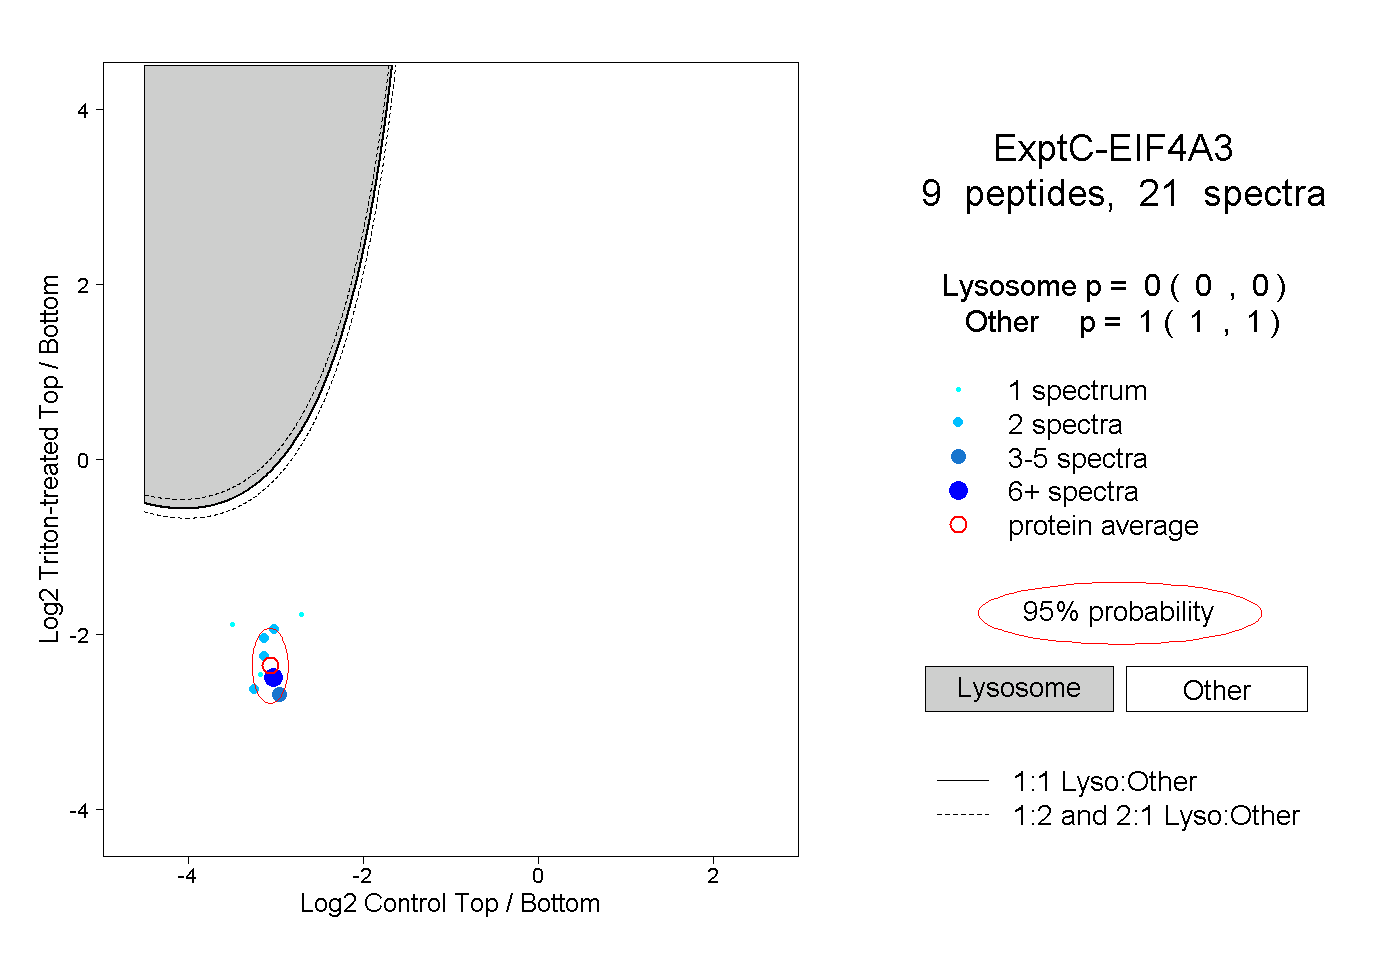
| Expt C |
9
peptides |
21
spectra |
 |
|
0.000
0.000 | 0.000 |
|
|
|
|
|
|
|
1.000
1.000 | 1.000 |
| | | Plot |
|
Lyso |
|
|
|
|
|
|
|
Other |
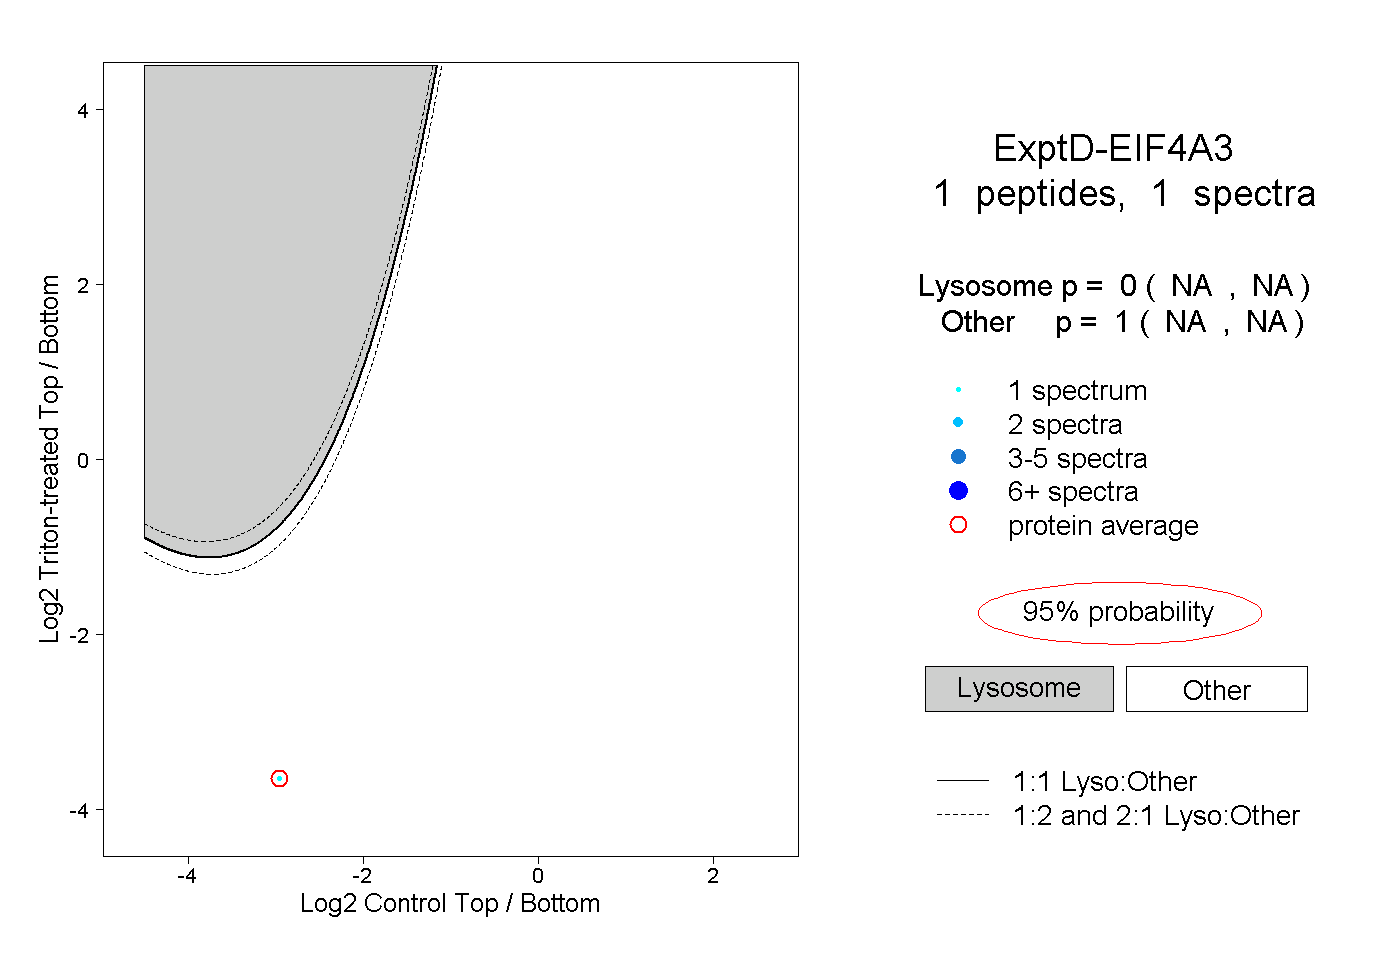
| Expt D |
1
peptide |
1
spectrum |
 |
|
0.000
NA | NA |
|
|
|
|
|
|
|
1.000
NA | NA |