 12
12peptides
spectra
0.000 | 0.000
0.000 | 0.000
0.000 | 0.000
0.226 | 0.238
0.000 | 0.000
0.000 | 0.000
0.323 | 0.338
0.430 | 0.442
| Plot | Mito | Lyso | Perox | ER | Golgi | PM | Cytosol | Nucleus | |||||
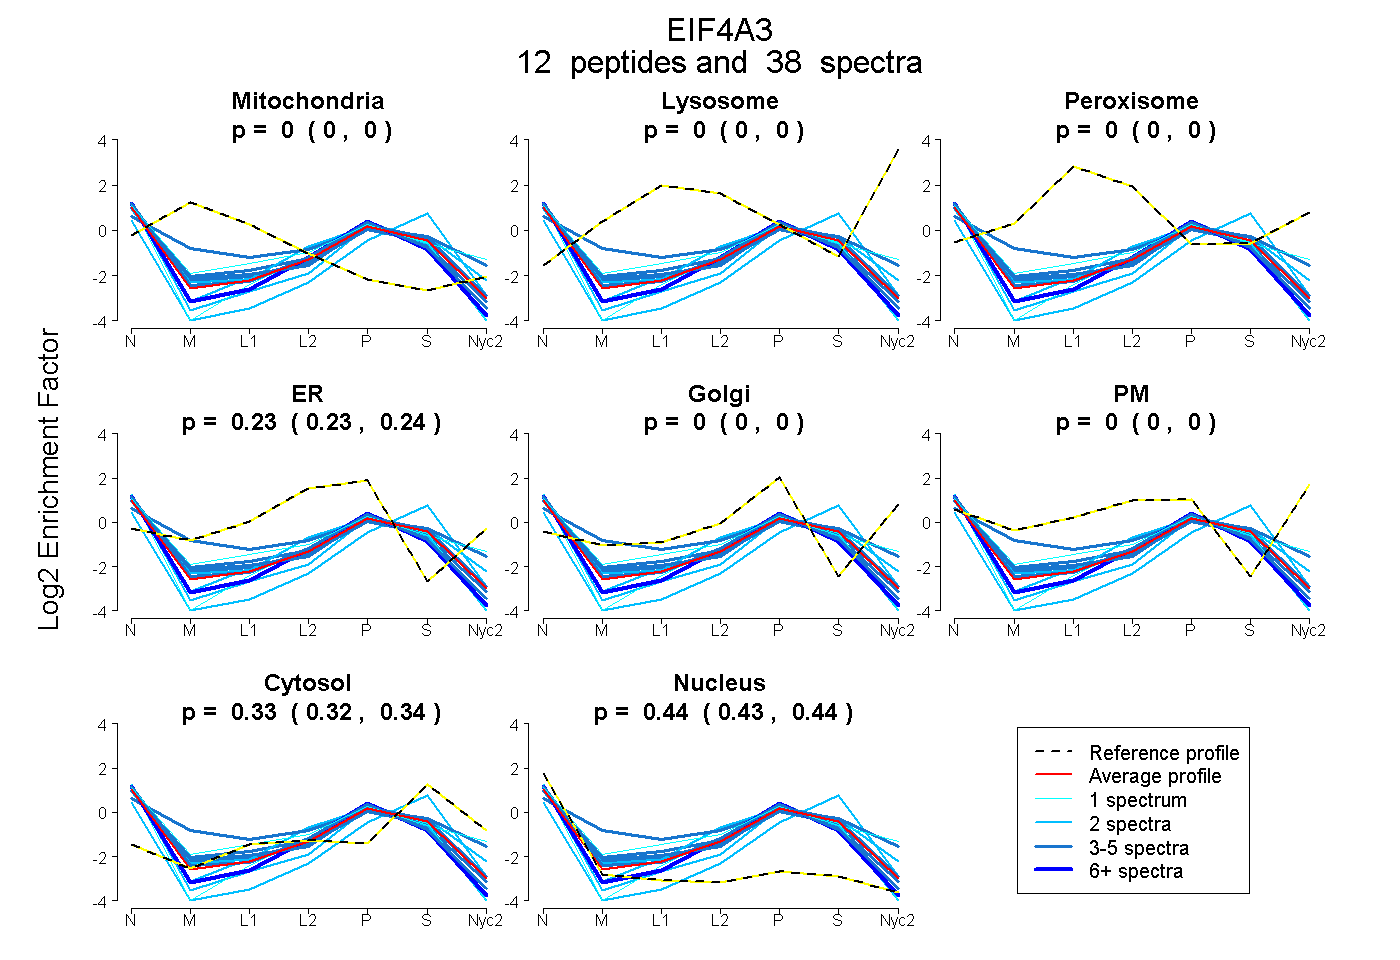
| Expt A |
12 peptides |
38 spectra |
|
0.000 0.000 | 0.000 |
0.000 0.000 | 0.000 |
0.000 0.000 | 0.000 |
0.232 0.226 | 0.238 |
0.000 0.000 | 0.000 |
0.000 0.000 | 0.000 |
0.331 0.323 | 0.338 |
0.437 0.430 | 0.442 |
| 4 spectra, ETQALILAPTR | 0.000 | 0.000 | 0.000 | 0.243 | 0.000 | 0.000 | 0.316 | 0.441 | ||
| 4 spectra, ELYIHR | 0.000 | 0.000 | 0.000 | 0.314 | 0.000 | 0.000 | 0.257 | 0.429 | ||
| 2 spectra, FMTDPIR | 0.000 | 0.000 | 0.000 | 0.296 | 0.000 | 0.000 | 0.380 | 0.324 | ||
| 3 spectra, LDYGQHVVAGTPGR | 0.111 | 0.000 | 0.000 | 0.276 | 0.033 | 0.035 | 0.377 | 0.168 | ||
| 4 spectra, VFDMIR | 0.000 | 0.000 | 0.000 | 0.280 | 0.000 | 0.000 | 0.228 | 0.492 | ||
| 3 spectra, QFFVAVER | 0.000 | 0.000 | 0.000 | 0.242 | 0.000 | 0.000 | 0.347 | 0.412 | ||
| 2 spectra, DELTLEGIK | 0.000 | 0.000 | 0.000 | 0.000 | 0.000 | 0.000 | 0.575 | 0.425 | ||
| 2 spectra, EQIYDVYR | 0.000 | 0.000 | 0.000 | 0.116 | 0.000 | 0.000 | 0.285 | 0.600 | ||
| 1 spectrum, GVAINFVK | 0.000 | 0.000 | 0.000 | 0.171 | 0.000 | 0.000 | 0.288 | 0.541 | ||
| 1 spectrum, VLISTDVWAR | 0.000 | 0.000 | 0.000 | 0.158 | 0.143 | 0.103 | 0.313 | 0.282 | ||
| 10 spectra, MLVLDEADEMLNK | 0.000 | 0.000 | 0.000 | 0.231 | 0.000 | 0.000 | 0.220 | 0.549 | ||
| 2 spectra, ELAVQIQK | 0.000 | 0.000 | 0.000 | 0.190 | 0.000 | 0.000 | 0.363 | 0.447 |
| Plot | Mito | Lyso or Perox | ER | Golgi | PM | Cytosol | Nucleus | ||||||
| Expt B |
5 peptides |
9 spectra |
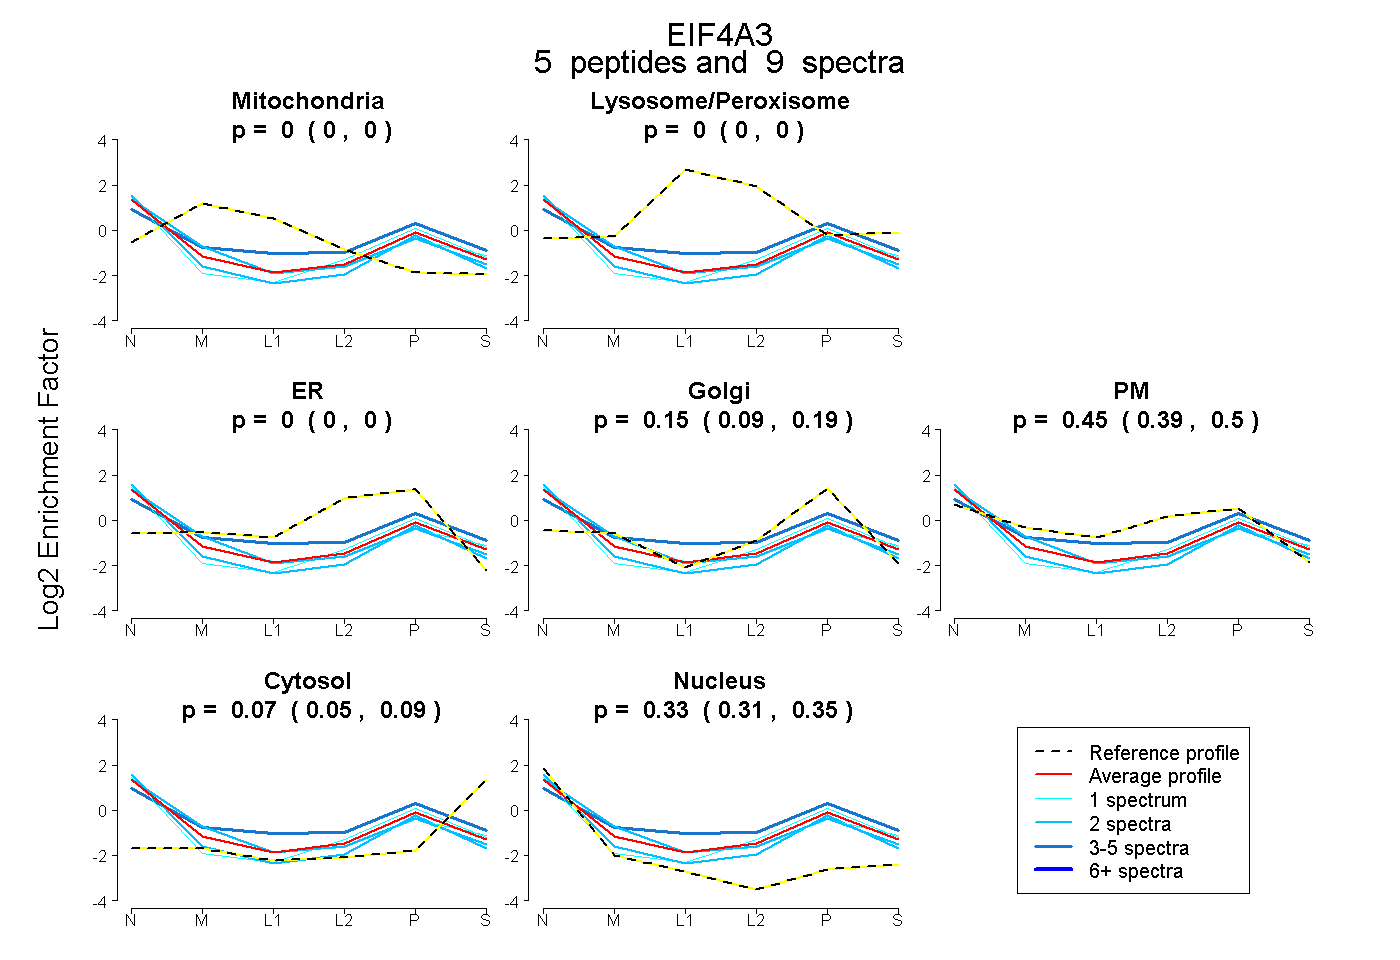 |
0.000 0.000 | 0.000 |
0.000 0.000 | 0.000 |
0.000 0.000 | 0.000 |
0.149 0.086 | 0.194 |
0.448 0.393 | 0.502 |
0.070 0.048 | 0.090 |
0.333 0.311 | 0.350 |
|||
| Plot | Lyso | Other | |||||||||||
| Expt C |
9 peptides |
21 spectra |
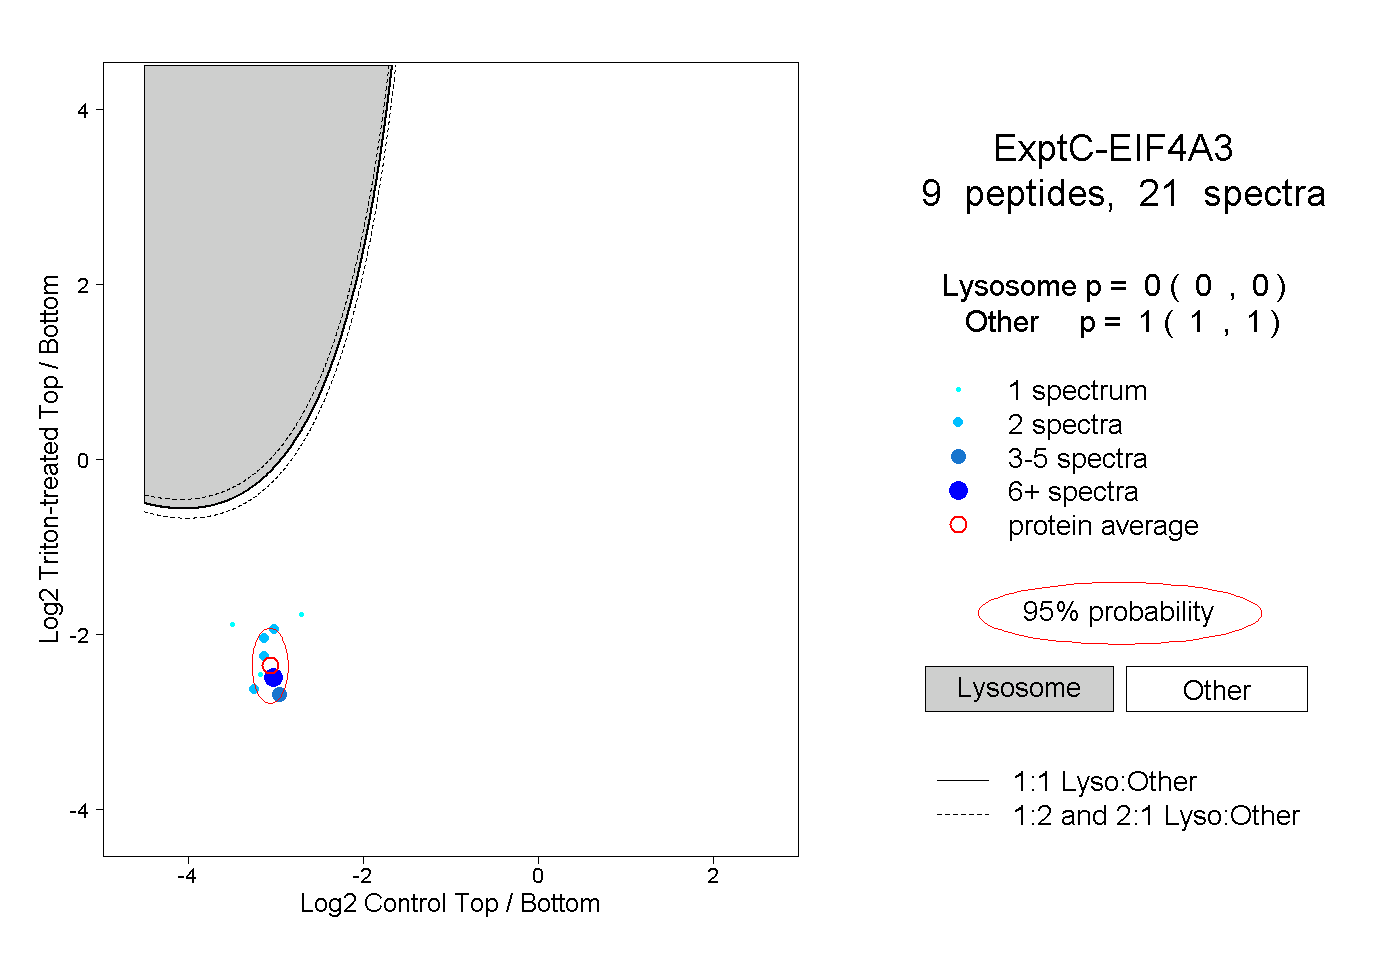 |
0.000 0.000 | 0.000 |
1.000 1.000 | 1.000 |
||||||||
| Plot | Lyso | Other | |||||||||||
| Expt D |
1 peptide |
1 spectrum |
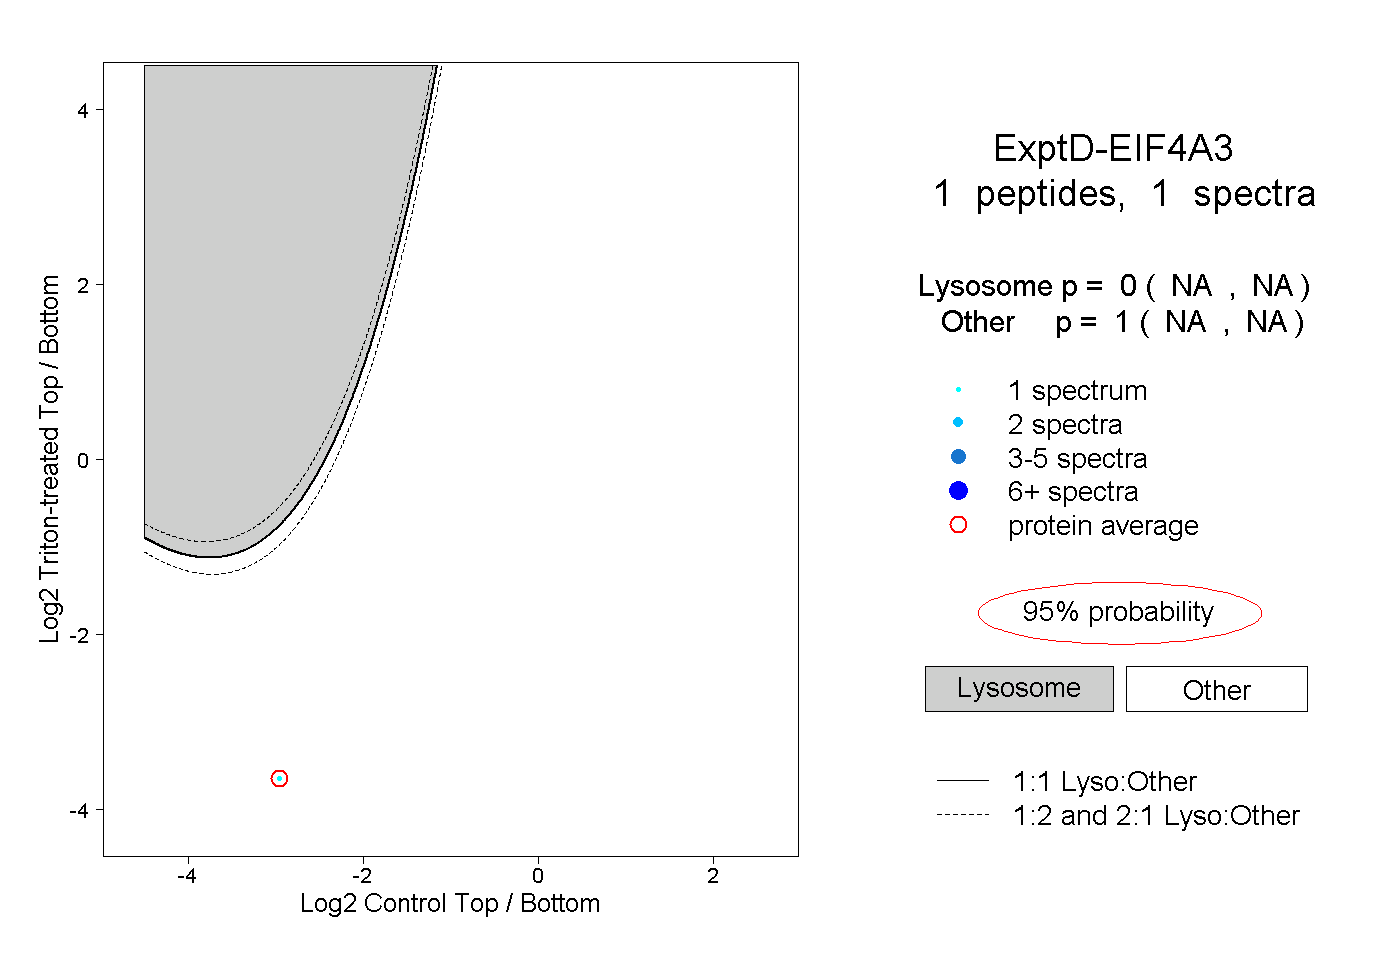 |
0.000 NA | NA |
1.000 NA | NA |