 16
16peptides
spectra
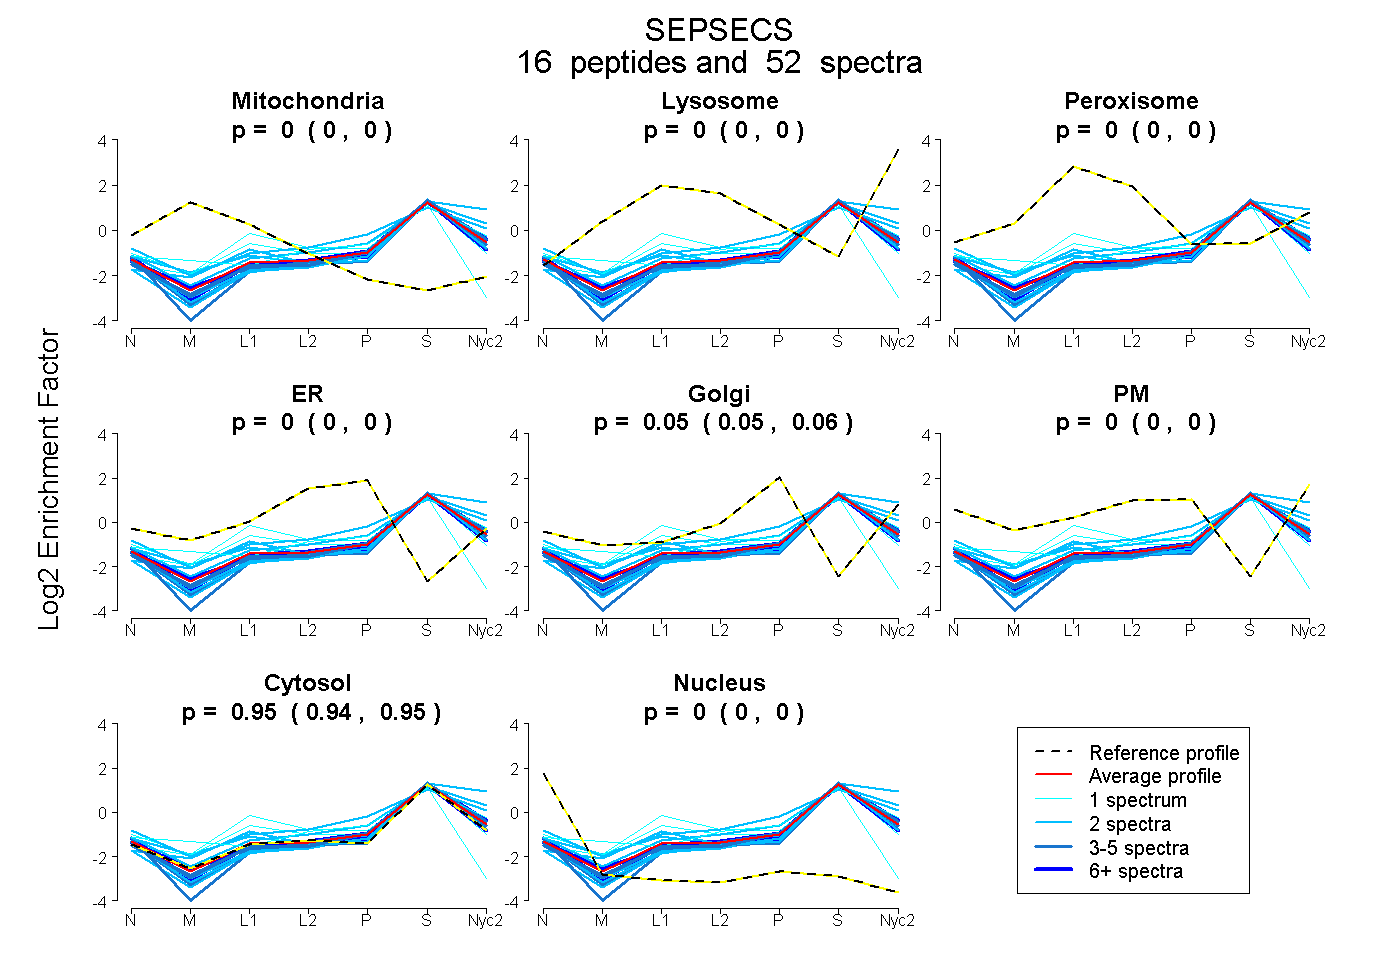
0.000 | 0.000
0.000 | 0.000
0.000 | 0.000
0.000 | 0.000
0.049 | 0.056
0.000 | 0.000
0.943 | 0.950
0.000 | 0.000
8peptides
spectra
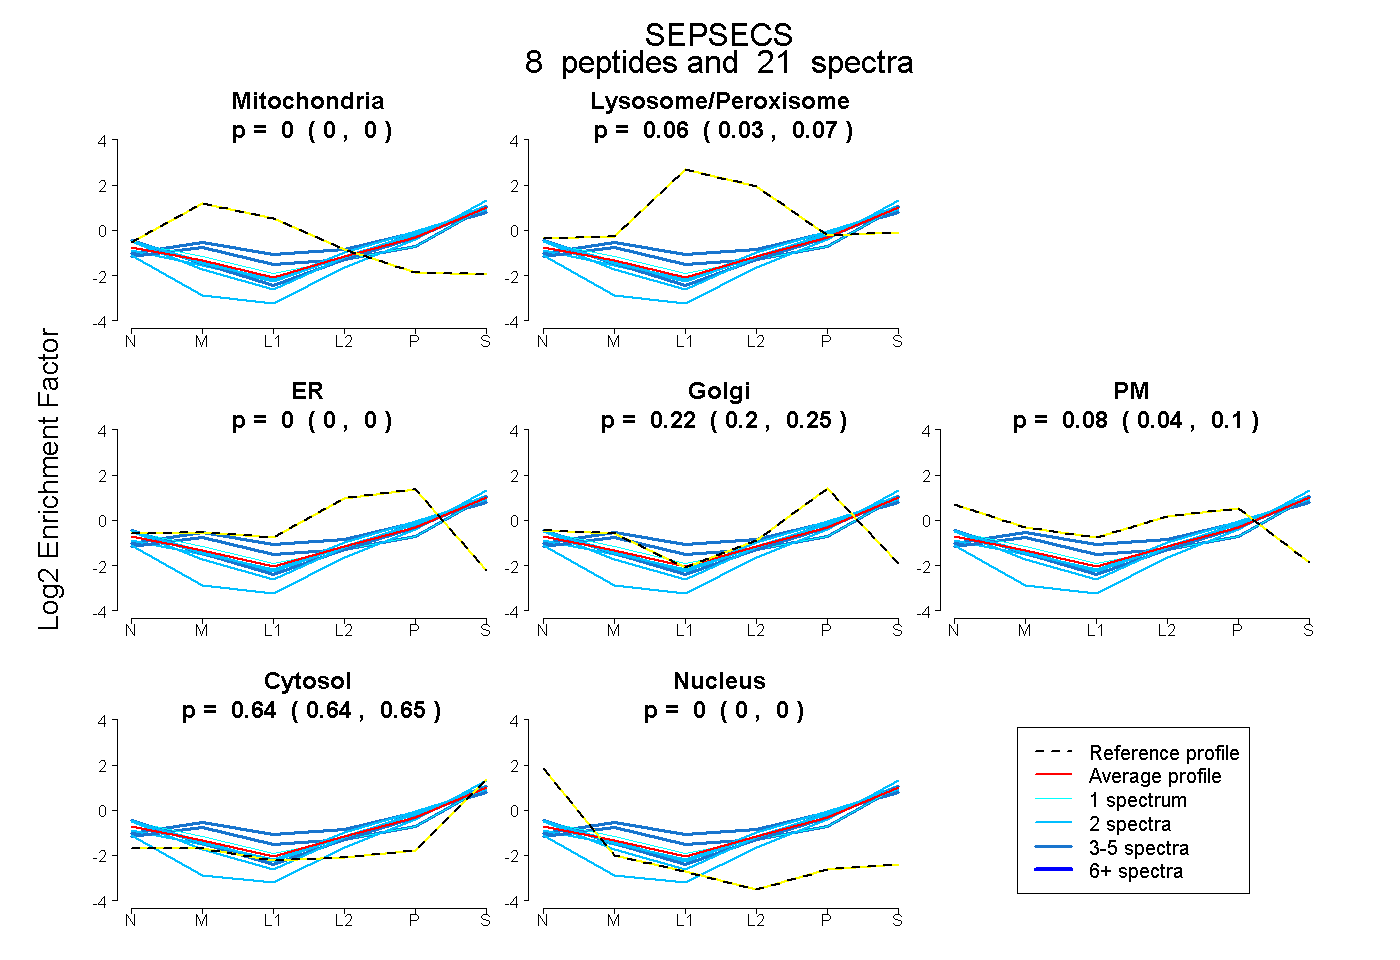
0.000 | 0.000
0.034 | 0.071
0.000 | 0.000
0.198 | 0.247
0.040 | 0.104
0.636 | 0.653
0.000 | 0.000
12peptides
spectra
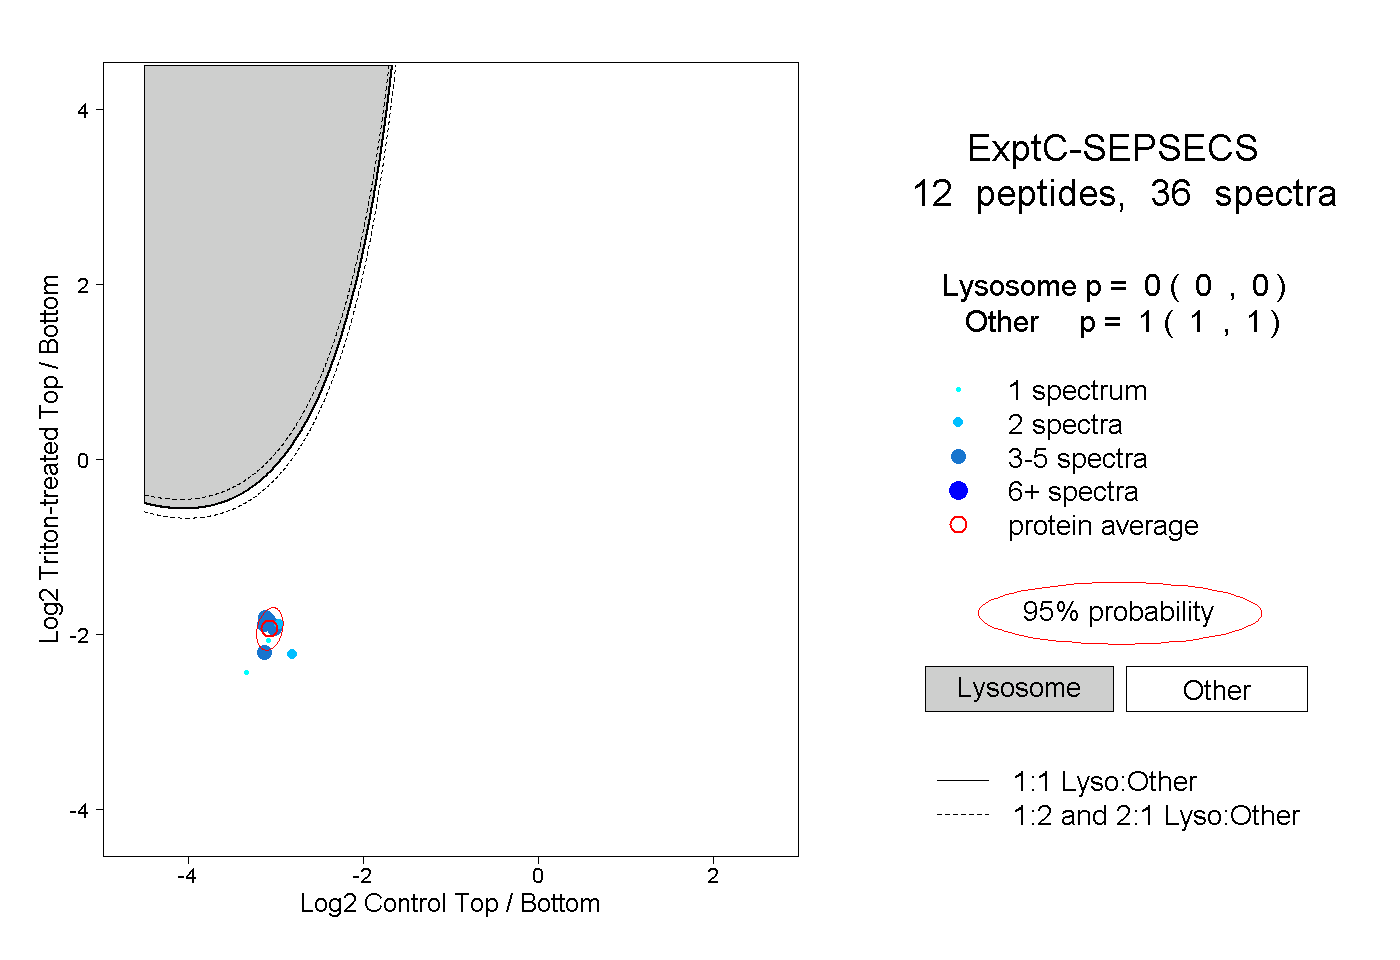
0.000 | 0.000
1.000 | 1.000
4peptides
spectra
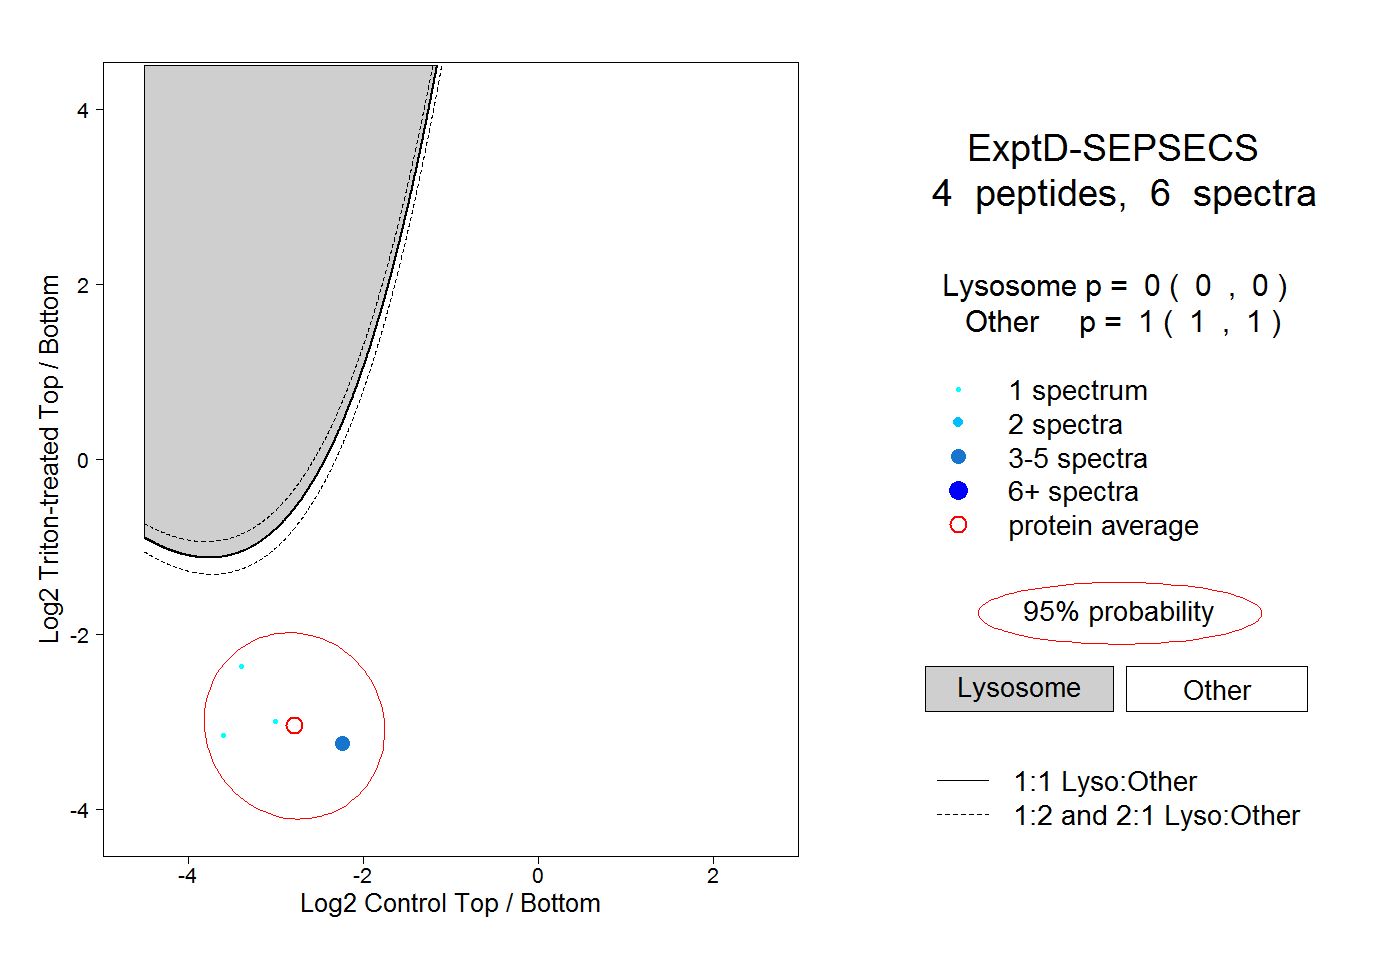
0.000 | 0.000
1.000 | 1.000