 16
16peptides
spectra
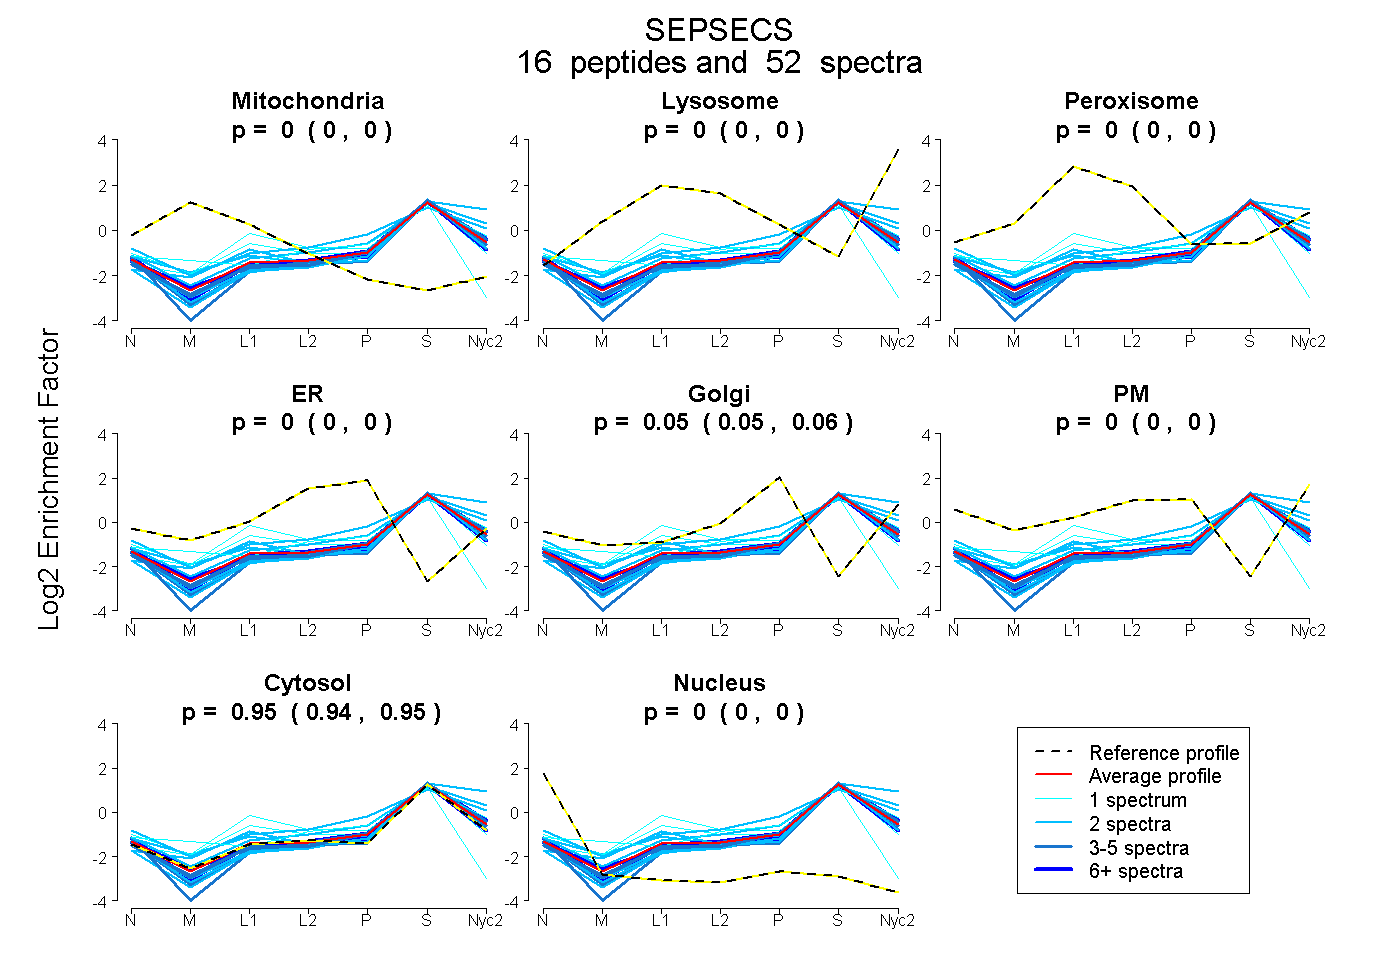
0.000 | 0.000
0.000 | 0.000
0.000 | 0.000
0.000 | 0.000
0.049 | 0.056
0.000 | 0.000
0.943 | 0.950
0.000 | 0.000
| Plot | Mito | Lyso | Perox | ER | Golgi | PM | Cytosol | Nucleus | |||||
| Expt A |
16 peptides |
52 spectra |
|
0.000 0.000 | 0.000 |
0.000 0.000 | 0.000 |
0.000 0.000 | 0.000 |
0.000 0.000 | 0.000 |
0.053 0.049 | 0.056 |
0.000 0.000 | 0.000 |
0.947 0.943 | 0.950 |
0.000 0.000 | 0.000 |
| 4 spectra, YIIWPR | 0.000 | 0.000 | 0.000 | 0.000 | 0.024 | 0.000 | 0.976 | 0.000 | ||
| 1 spectrum, AVPLGSVQTVSGHTFR | 0.011 | 0.000 | 0.133 | 0.000 | 0.000 | 0.000 | 0.856 | 0.000 | ||
| 4 spectra, LDDVLGHVDR | 0.000 | 0.000 | 0.000 | 0.000 | 0.000 | 0.000 | 0.974 | 0.026 | ||
| 8 spectra, FIHGIGR | 0.000 | 0.000 | 0.000 | 0.000 | 0.014 | 0.000 | 0.978 | 0.008 | ||
| 2 spectra, QVSGAR | 0.000 | 0.101 | 0.000 | 0.000 | 0.080 | 0.000 | 0.819 | 0.000 | ||
| 2 spectra, AEDADVEEMALK | 0.000 | 0.000 | 0.000 | 0.000 | 0.000 | 0.000 | 1.000 | 0.000 | ||
| 1 spectrum, VASALVAR | 0.011 | 0.081 | 0.000 | 0.000 | 0.124 | 0.000 | 0.784 | 0.000 | ||
| 3 spectra, VTPAYVR | 0.000 | 0.000 | 0.000 | 0.000 | 0.023 | 0.000 | 0.977 | 0.000 | ||
| 2 spectra, VQDVDLFIK | 0.000 | 0.000 | 0.000 | 0.000 | 0.000 | 0.000 | 0.981 | 0.019 | ||
| 2 spectra, AAGSSLLNK | 0.022 | 0.078 | 0.000 | 0.000 | 0.018 | 0.000 | 0.882 | 0.000 | ||
| 2 spectra, EMFAYLSTQLQK | 0.000 | 0.190 | 0.000 | 0.000 | 0.000 | 0.000 | 0.810 | 0.000 | ||
| 13 spectra, AVTQLGSMLFTR | 0.000 | 0.000 | 0.000 | 0.000 | 0.048 | 0.000 | 0.952 | 0.000 | ||
| 2 spectra, ITNSLVLNVIK | 0.000 | 0.081 | 0.000 | 0.000 | 0.124 | 0.059 | 0.736 | 0.000 | ||
| 3 spectra, IDVFVQSLDK | 0.000 | 0.000 | 0.000 | 0.000 | 0.000 | 0.000 | 1.000 | 0.000 | ||
| 2 spectra, SGDISAVQPK | 0.000 | 0.000 | 0.000 | 0.000 | 0.000 | 0.000 | 0.988 | 0.012 | ||
| 1 spectrum, CMHLIQQGAR | 0.152 | 0.000 | 0.058 | 0.015 | 0.000 | 0.000 | 0.747 | 0.027 |
| Plot | Mito | Lyso or Perox | ER | Golgi | PM | Cytosol | Nucleus | ||||||
| Expt B |
8 peptides |
21 spectra |
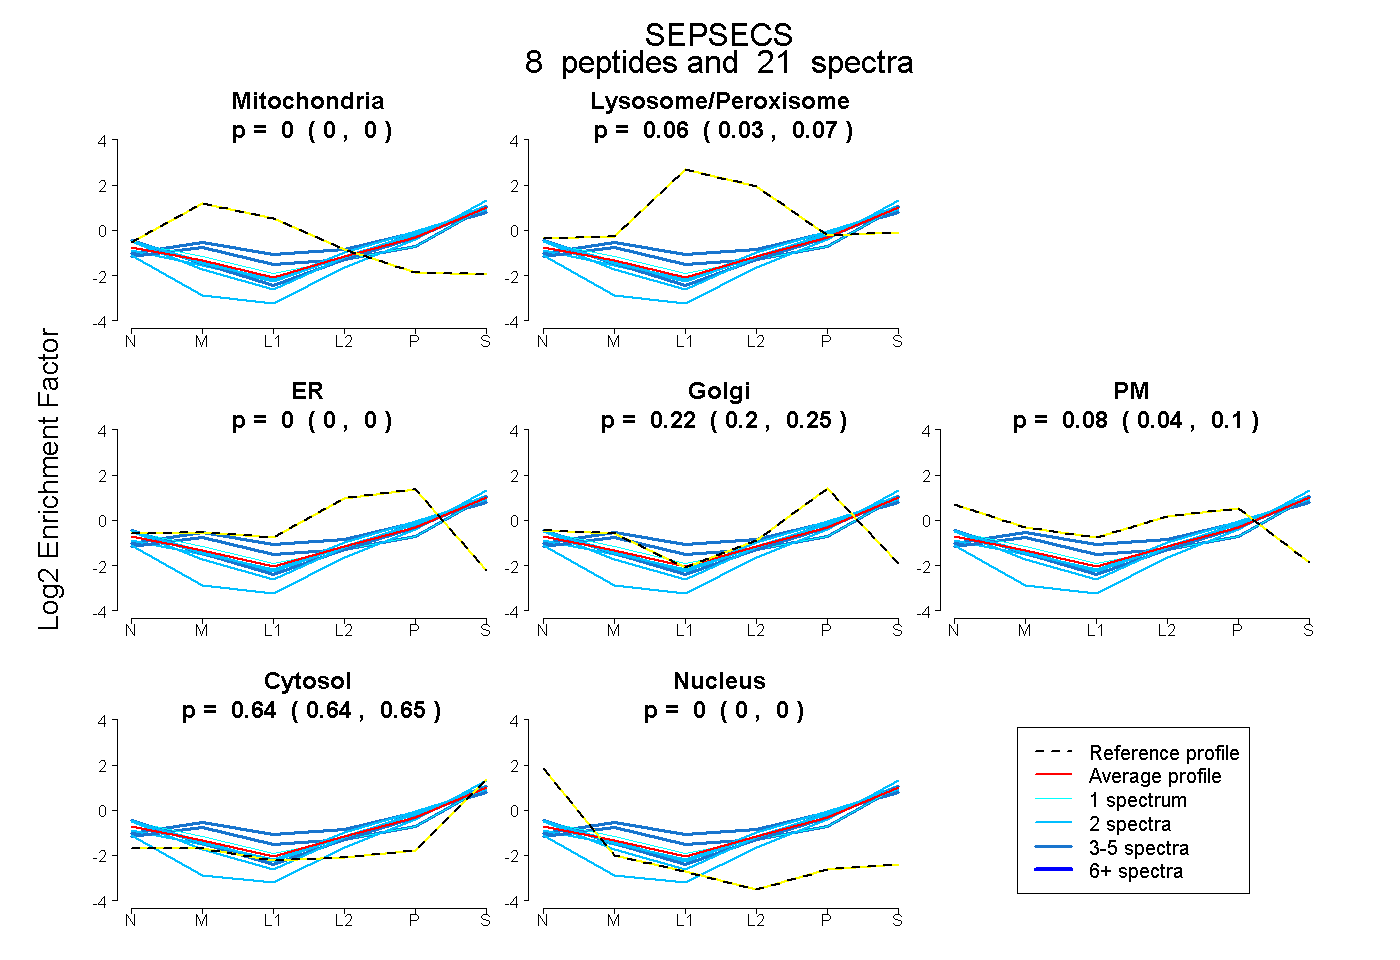 |
0.000 0.000 | 0.000 |
0.055 0.034 | 0.071 |
0.000 0.000 | 0.000 |
0.224 0.198 | 0.247 |
0.076 0.040 | 0.104 |
0.645 0.636 | 0.653 |
0.000 0.000 | 0.000 |
|||
| Plot | Lyso | Other | |||||||||||
| Expt C |
12 peptides |
36 spectra |
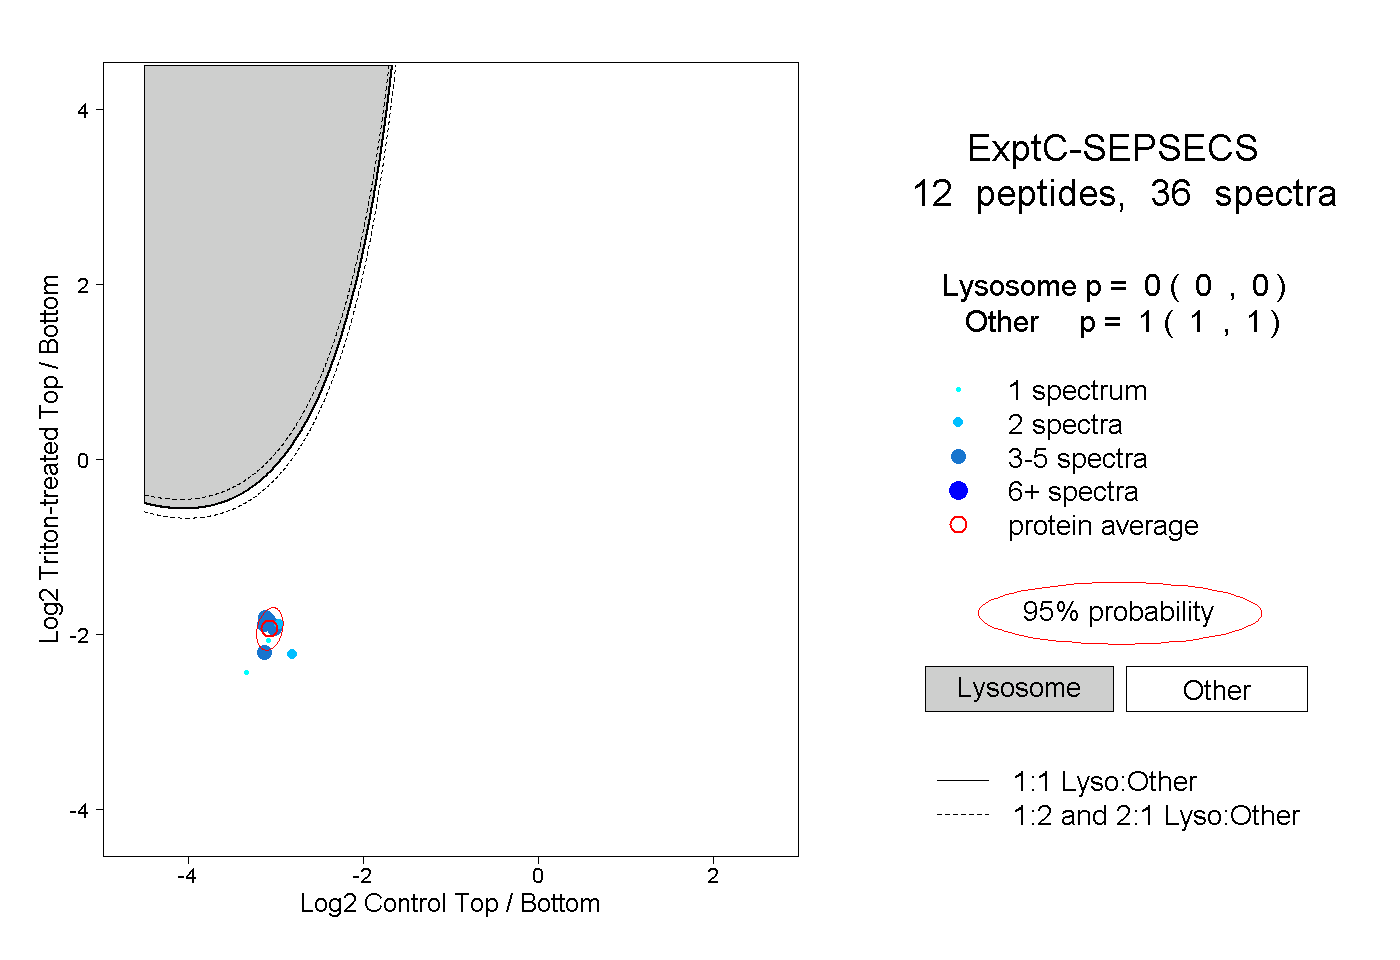 |
0.000 0.000 | 0.000 |
1.000 1.000 | 1.000 |
||||||||
| Plot | Lyso | Other | |||||||||||
| Expt D |
4 peptides |
6 spectra |
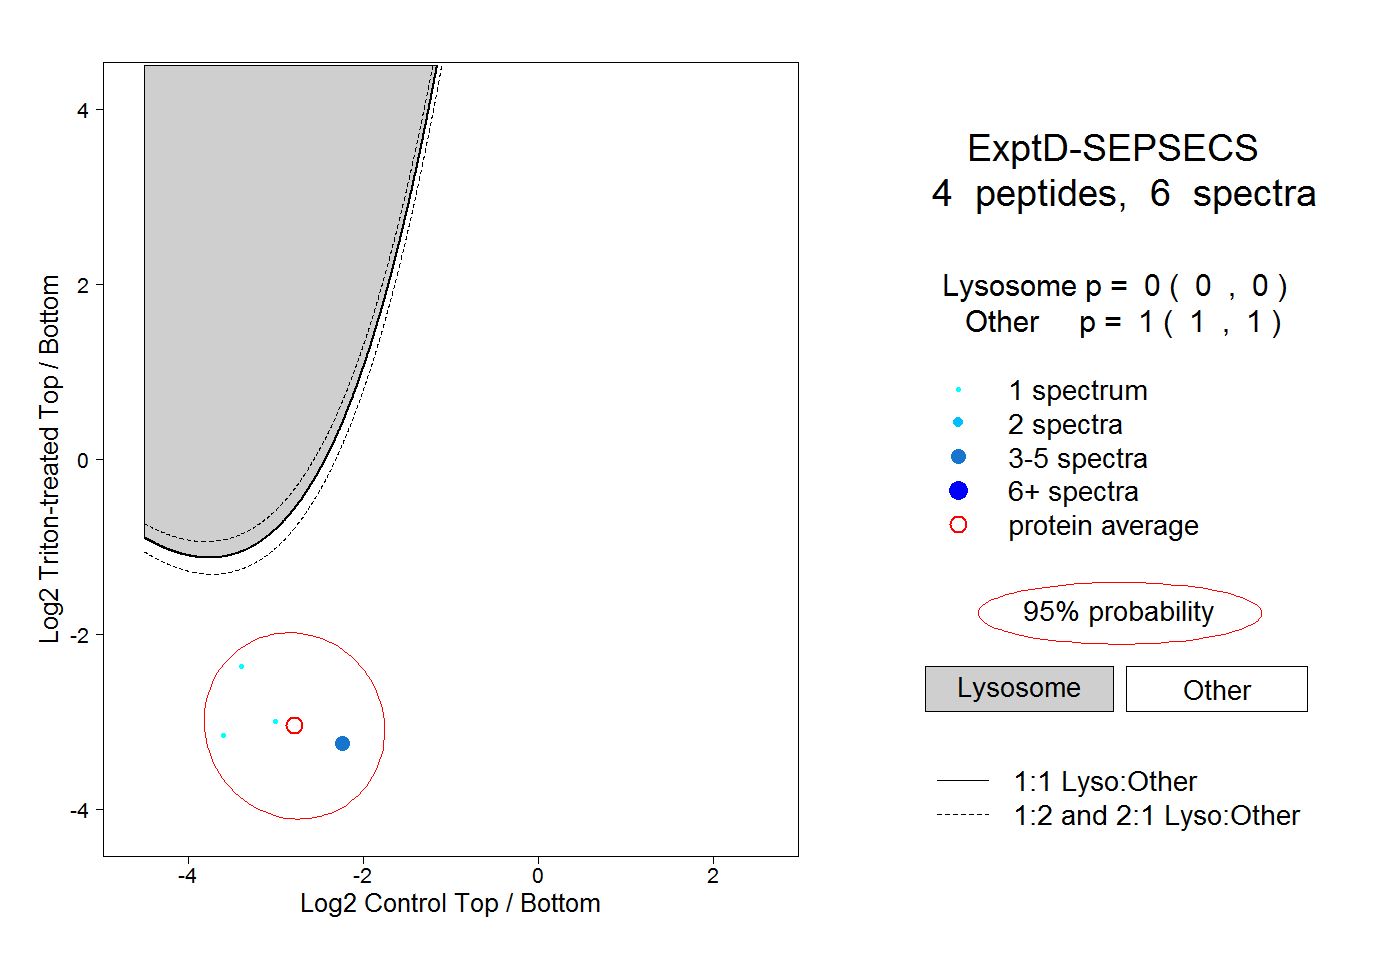 |
0.000 0.000 | 0.000 |
1.000 1.000 | 1.000 |