SEPSECS
[ENSRNOP00000065651]
Main page
| | | Plot |
Mito |
Lyso |
|
Perox |
ER |
Golgi |
PM |
Cytosol |
Nucleus |
|
| Expt A |
 16
16
peptides |
52
spectra |
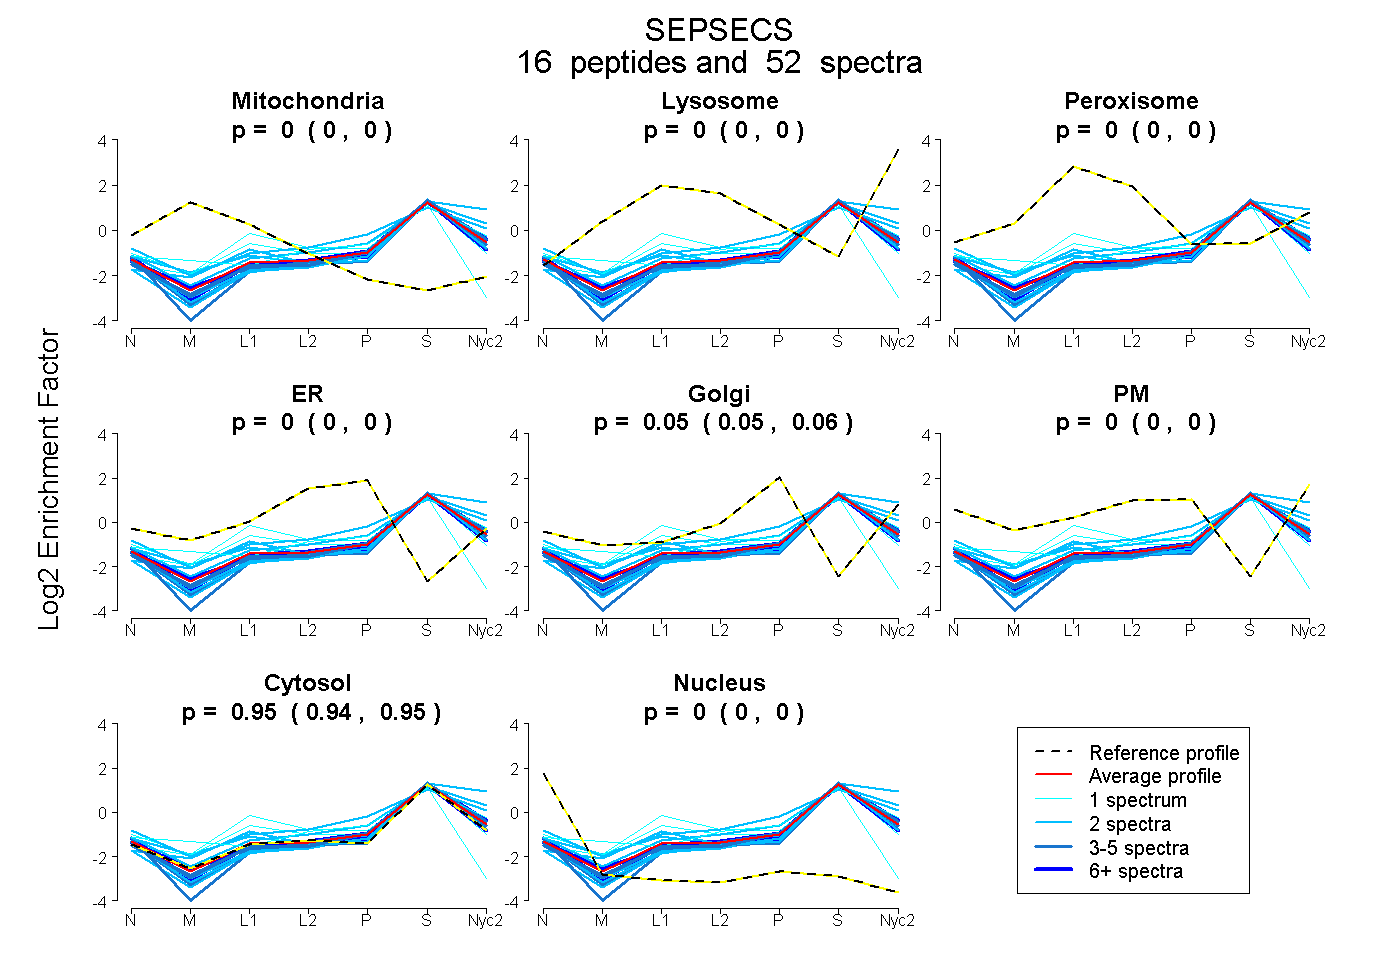 |
0.000
0.000 | 0.000 |
0.000
0.000 | 0.000 |
|
0.000
0.000 | 0.000 |
0.000
0.000 | 0.000 |
0.053
0.049 | 0.056 |
0.000
0.000 | 0.000 |
0.947
0.943 | 0.950 |
0.000
0.000 | 0.000 |
|
| | | Plot |
Mito |
|
Lyso or Perox |
|
ER |
Golgi |
PM |
Cytosol |
Nucleus |
|
| Expt B |
8
peptides |
21
spectra |
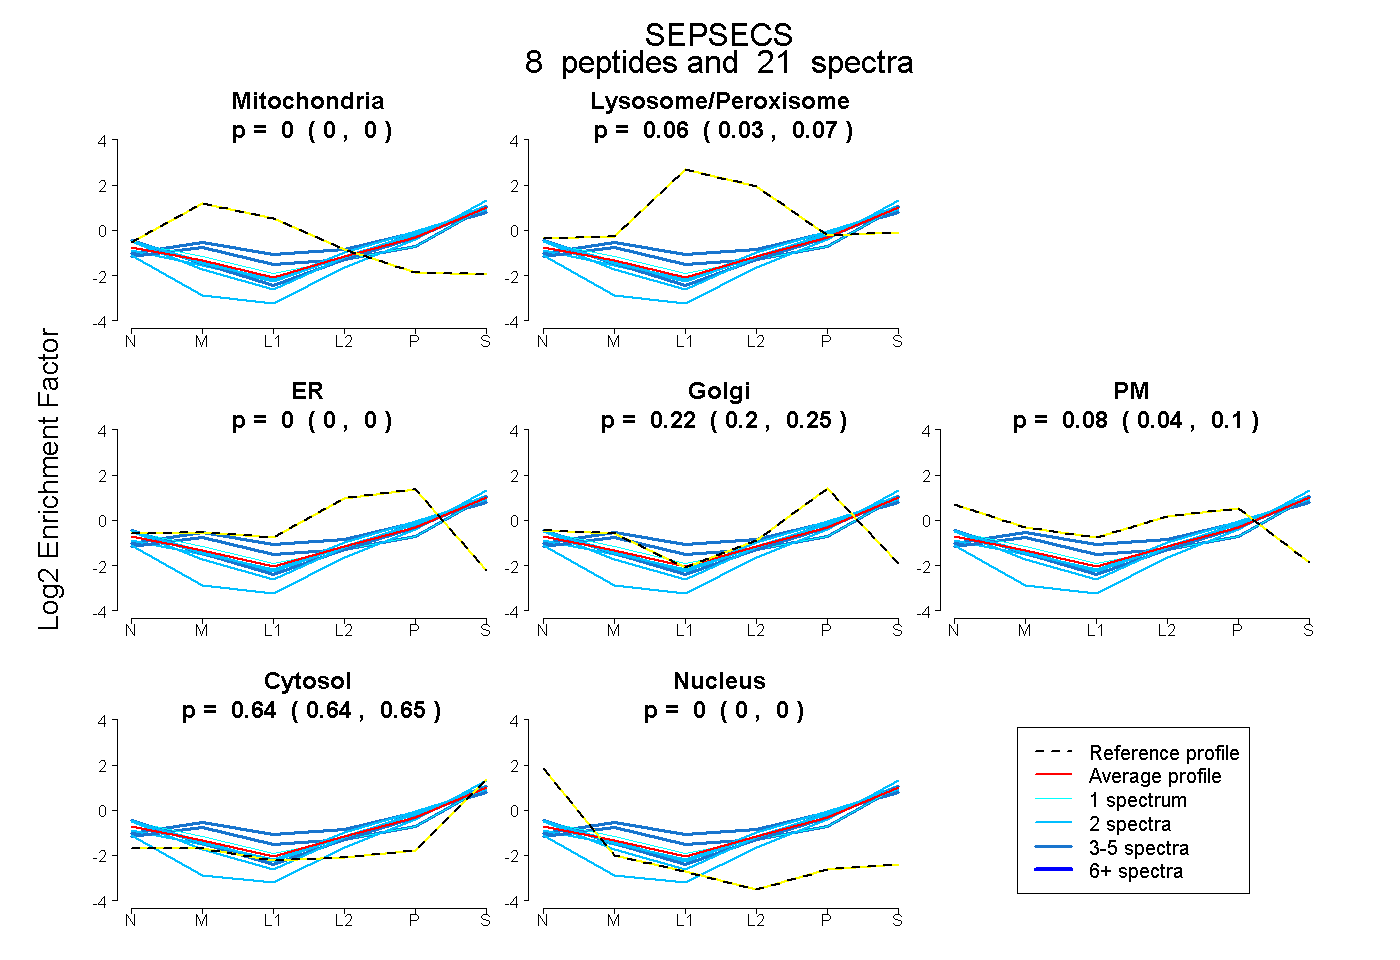 |
0.000
0.000 | 0.000 |
|
0.055
0.034 | 0.071 |
|
0.000
0.000 | 0.000 |
0.224
0.198 | 0.247 |
0.076
0.040 | 0.104 |
0.645
0.636 | 0.653 |
0.000
0.000 | 0.000 |
|
| 2 spectra, VTPAYVR |
0.000 |
|
0.004 |
|
0.000 |
0.215 |
0.182 |
0.598 |
0.000 |
|
| 2 spectra, VQDVDLFIK |
0.000 |
|
0.000 |
|
0.000 |
0.303 |
0.048 |
0.649 |
0.000 |
|
| 2 spectra, YIIWPR |
0.000 |
|
0.000 |
|
0.000 |
0.160 |
0.204 |
0.636 |
0.000 |
|
| 3 spectra, AVTQLGSMLFTR |
0.000 |
|
0.246 |
|
0.000 |
0.253 |
0.000 |
0.501 |
0.000 |
|
| 2 spectra, FIHGIGR |
0.000 |
|
0.047 |
|
0.008 |
0.284 |
0.000 |
0.661 |
0.000 |
|
| 1 spectrum, ITNSLVLNVIK |
0.000 |
|
0.014 |
|
0.000 |
0.000 |
0.289 |
0.697 |
0.000 |
|
| 6 spectra, LDDVLGHVDR |
0.000 |
|
0.000 |
|
0.000 |
0.280 |
0.000 |
0.720 |
0.000 |
|
| 3 spectra, IDVFVQSLDK |
0.000 |
|
0.159 |
|
0.000 |
0.166 |
0.000 |
0.675 |
0.000 |
|
| | | Plot |
|
Lyso |
|
|
|
|
|
|
|
Other |
| Expt C |
12
peptides |
36
spectra |
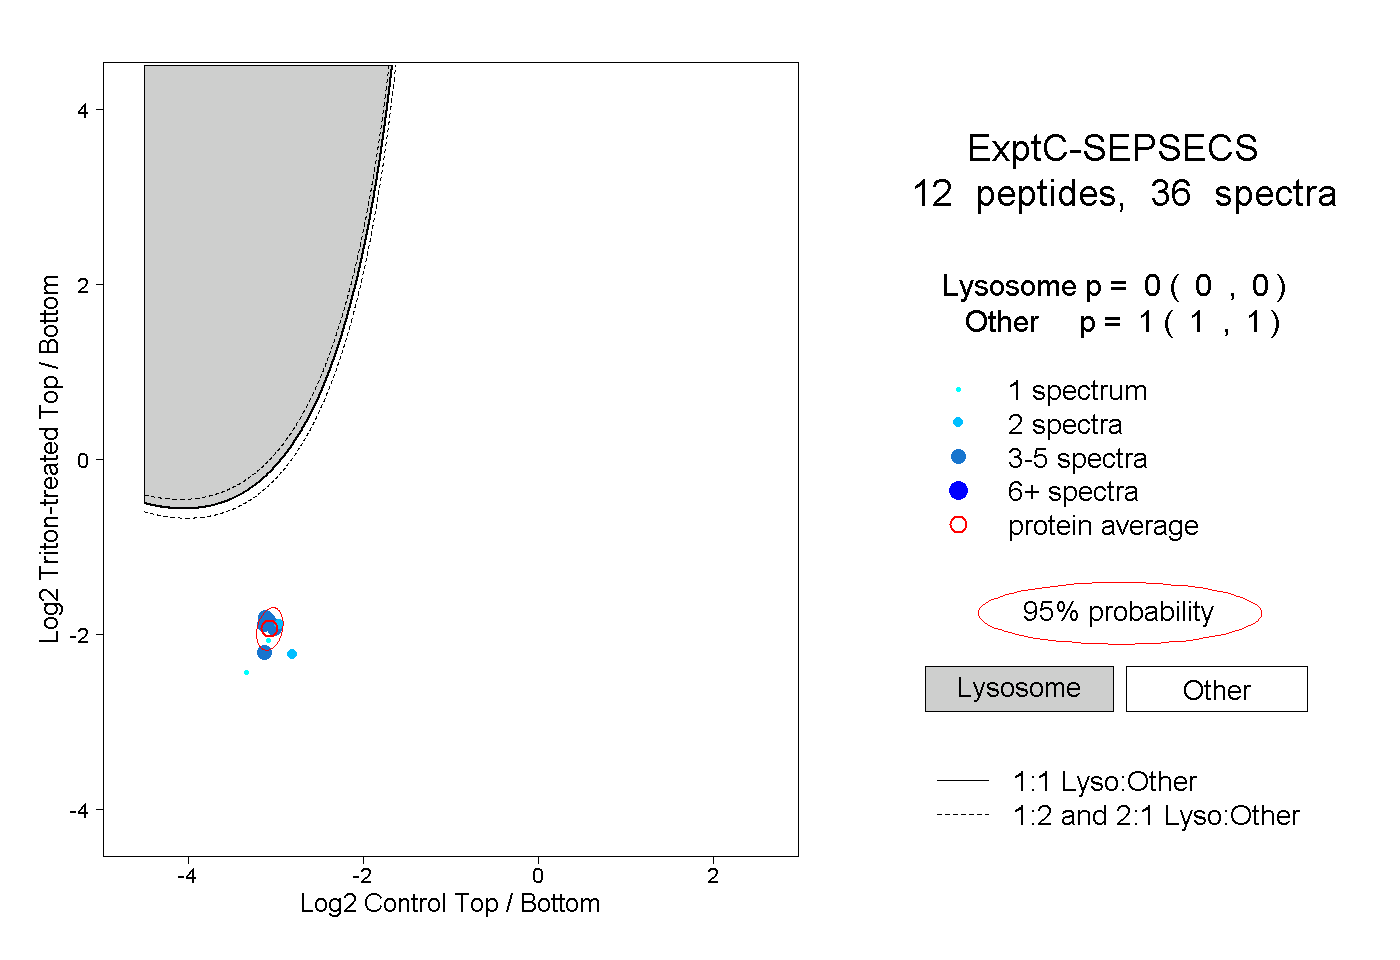 |
|
0.000
0.000 | 0.000 |
|
|
|
|
|
|
|
1.000
1.000 | 1.000 |
| | | Plot |
|
Lyso |
|
|
|
|
|
|
|
Other |
| Expt D |
4
peptides |
6
spectra |
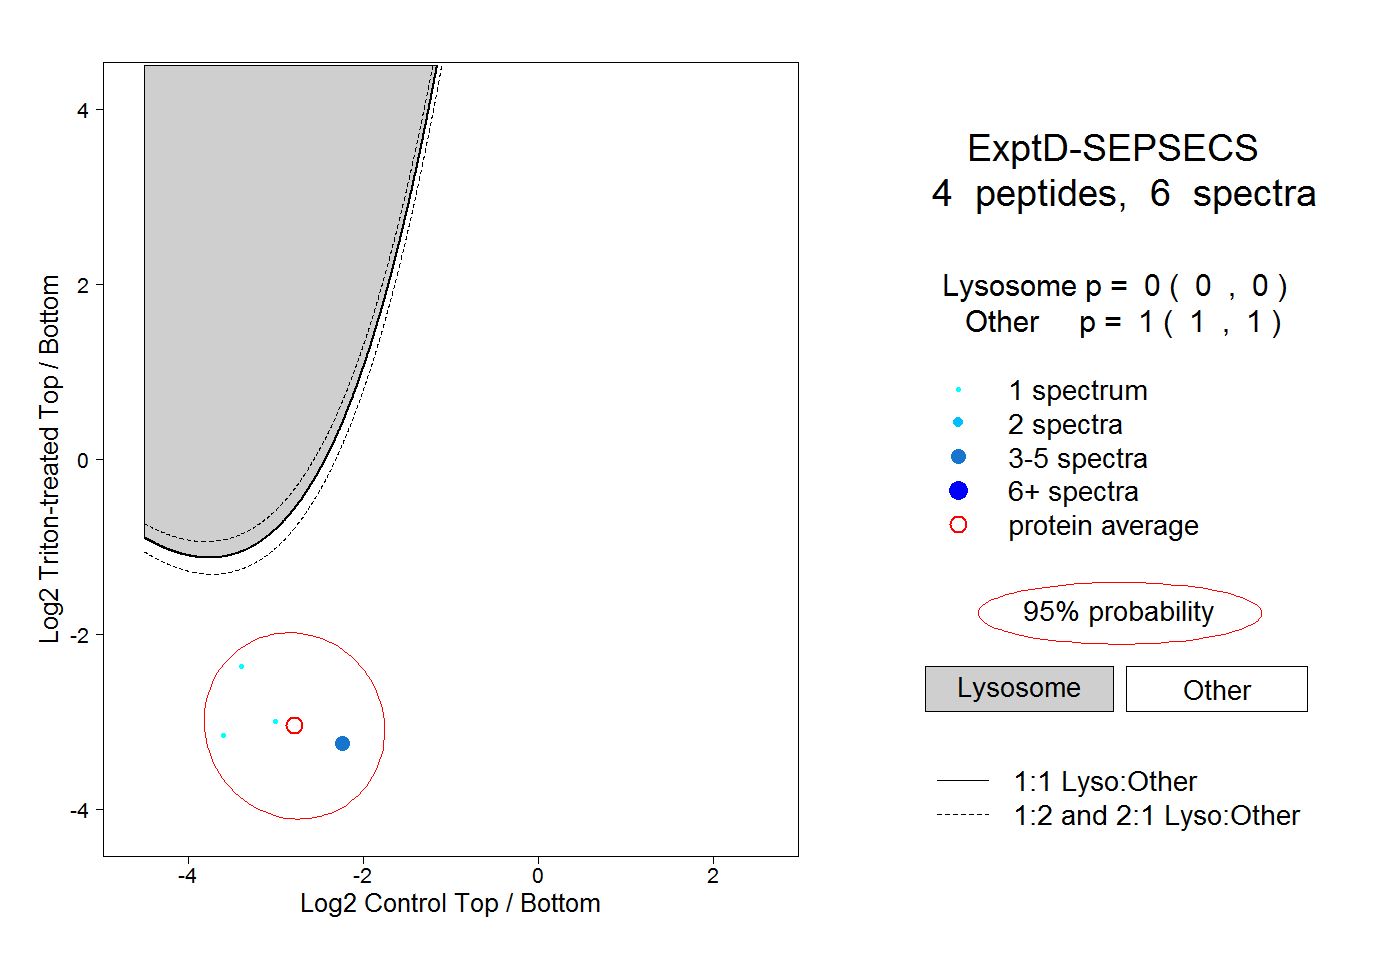 |
|
0.000
0.000 | 0.000 |
|
|
|
|
|
|
|
1.000
1.000 | 1.000 |