 12
12peptides
spectra
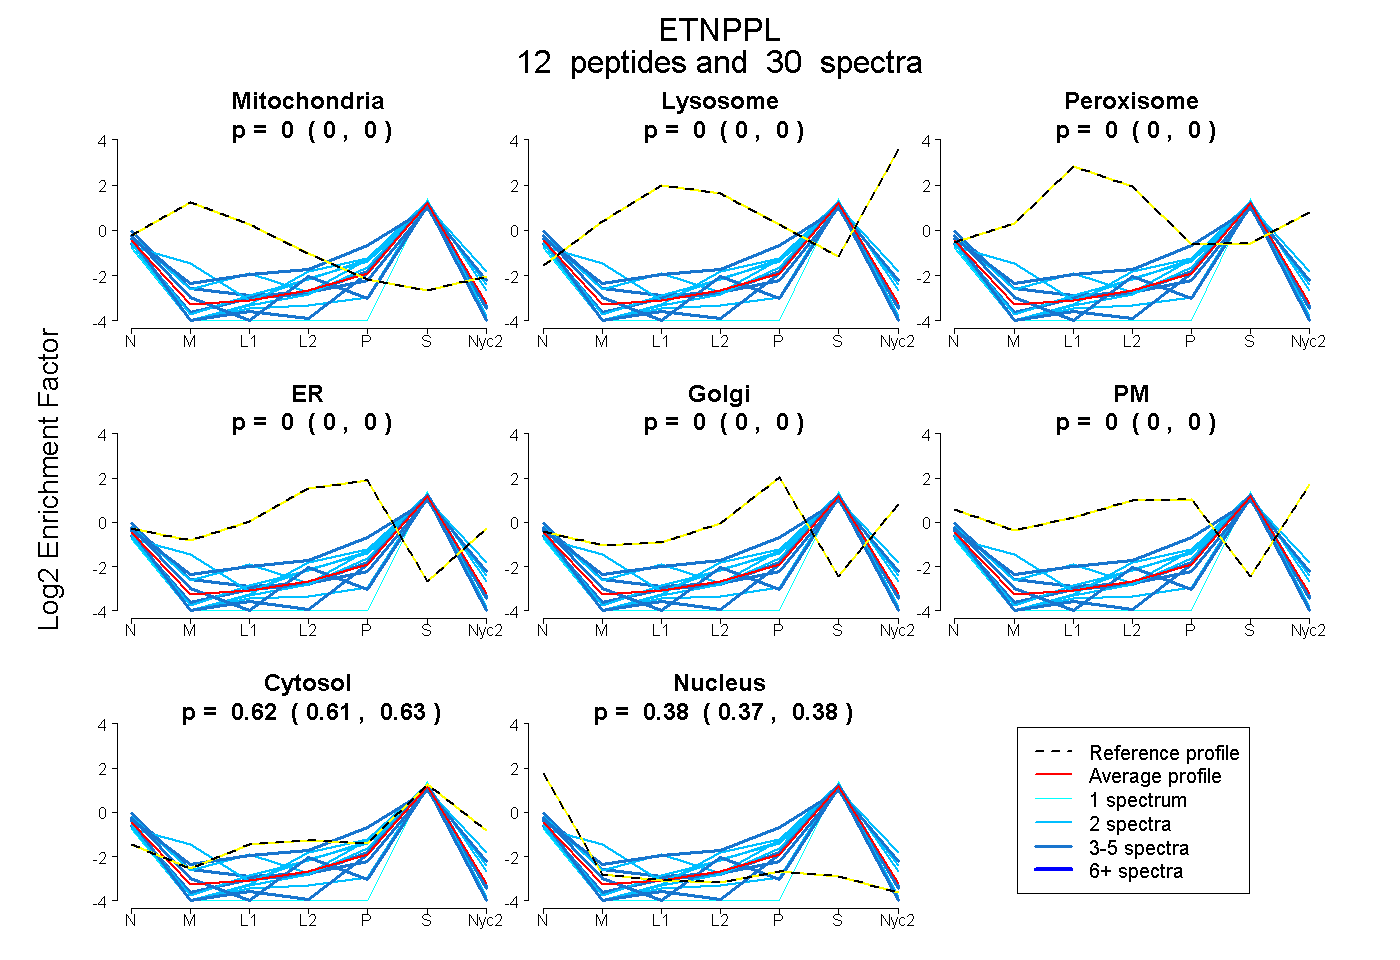
0.000 | 0.000
0.000 | 0.000
0.000 | 0.000
0.000 | 0.000
0.000 | 0.000
0.000 | 0.000
0.614 | 0.628
0.370 | 0.384
4peptides
spectra
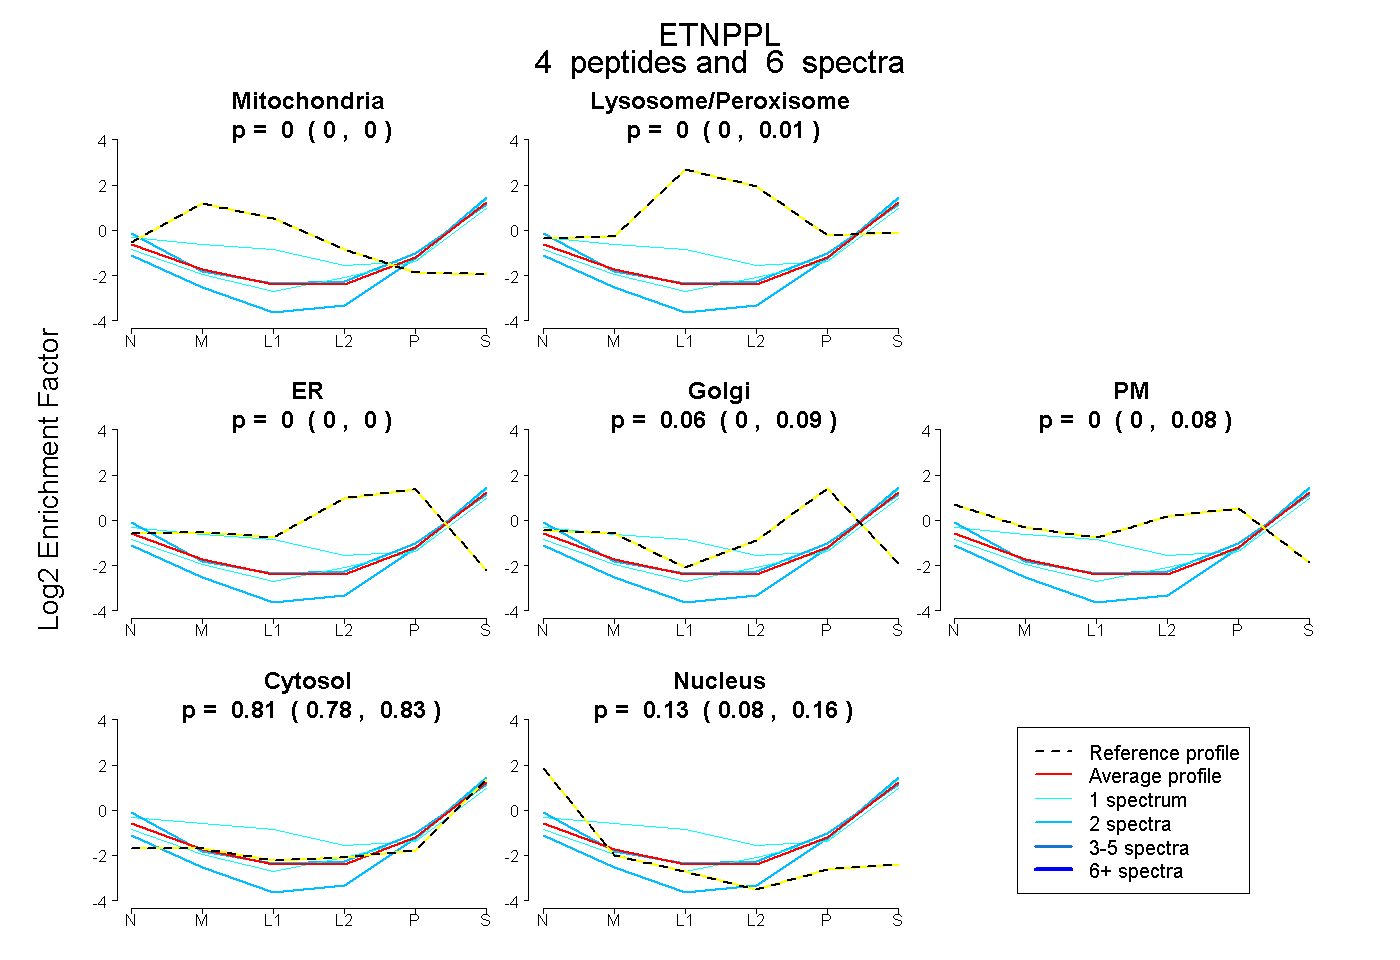
0.000 | 0.000
0.000 | 0.007
0.000 | 0.000
0.000 | 0.086
0.000 | 0.084
0.780 | 0.832
0.080 | 0.159
1peptide
spectrum
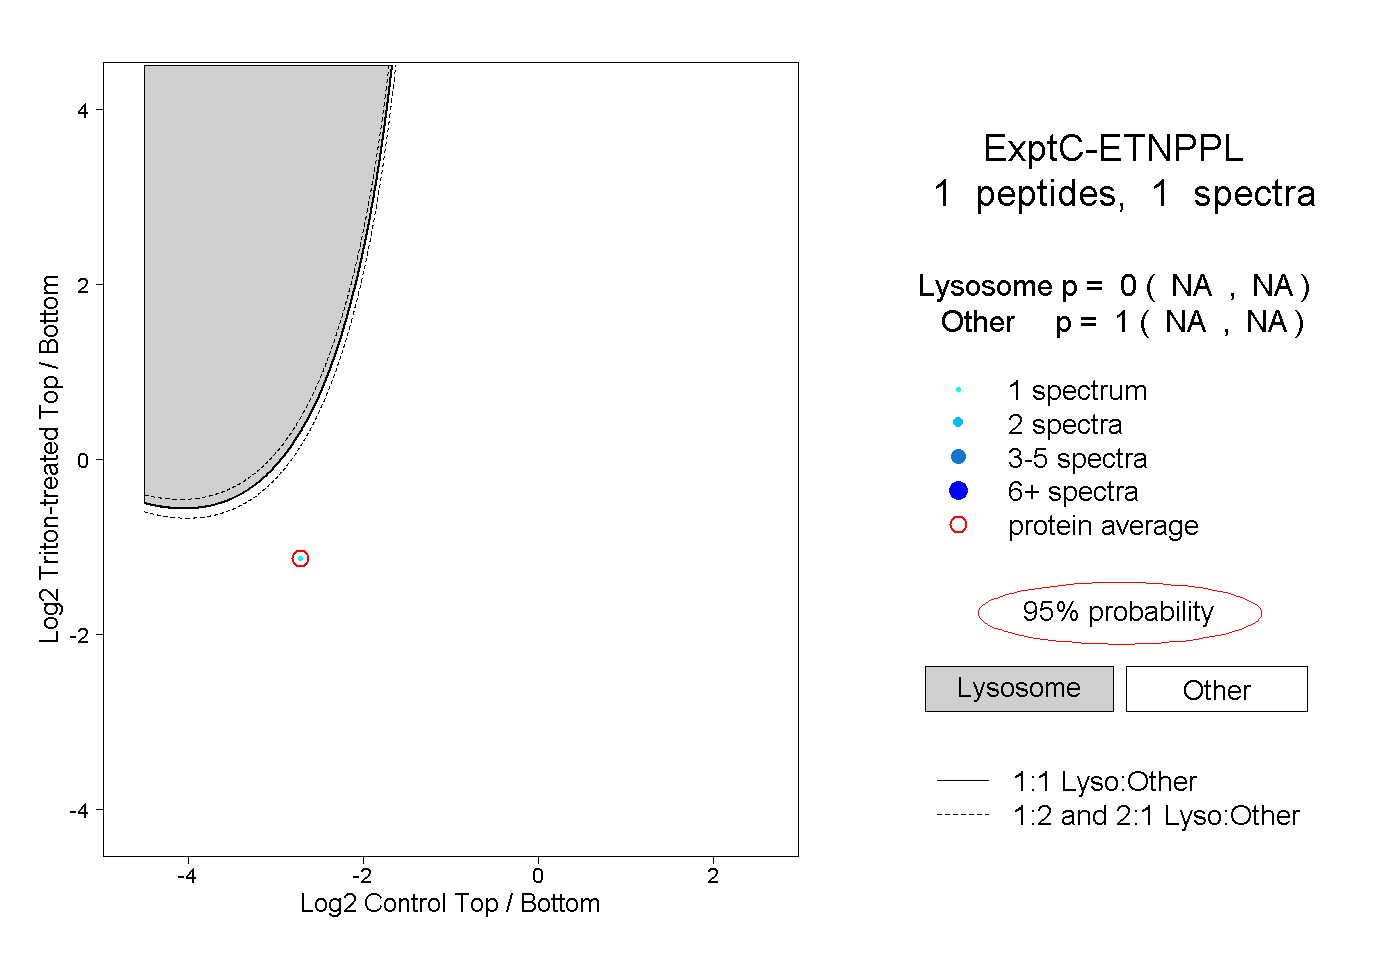
NA | NA
NA | NA