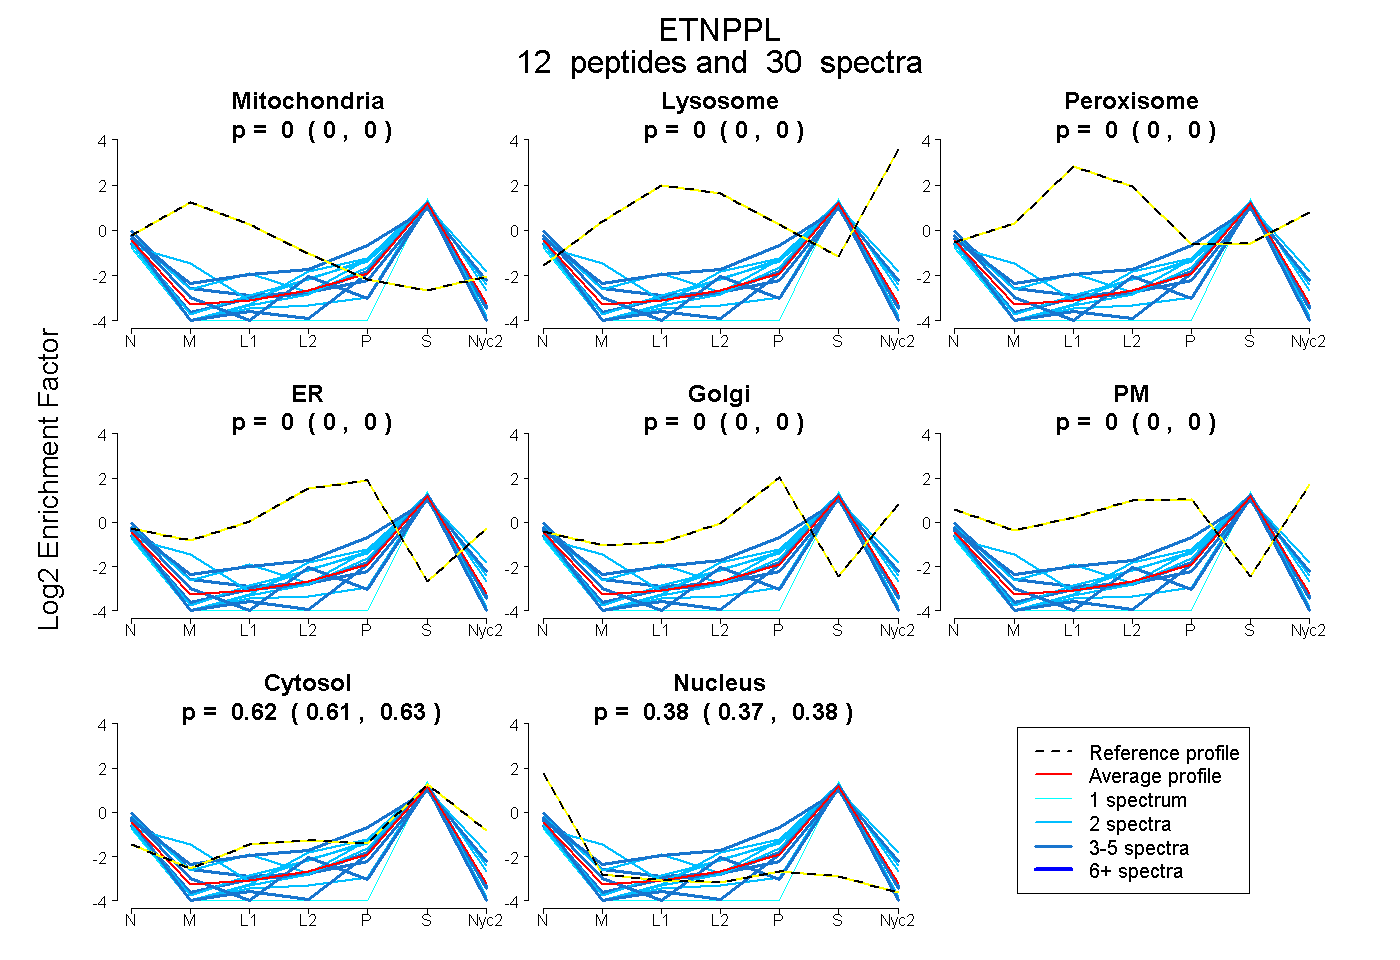
 12
12peptides
spectra
0.000 | 0.000
0.000 | 0.000
0.000 | 0.000
0.000 | 0.000
0.000 | 0.000
0.000 | 0.000
0.614 | 0.628
0.370 | 0.384
| Plot | Mito | Lyso | Perox | ER | Golgi | PM | Cytosol | Nucleus | |||||
| Expt A |
12 peptides |
30 spectra |
|
0.000 0.000 | 0.000 |
0.000 0.000 | 0.000 |
0.000 0.000 | 0.000 |
0.000 0.000 | 0.000 |
0.000 0.000 | 0.000 |
0.000 0.000 | 0.000 |
0.622 0.614 | 0.628 |
0.378 0.370 | 0.384 |
| 3 spectra, VAEHVR | 0.000 | 0.000 | 0.000 | 0.021 | 0.000 | 0.000 | 0.768 | 0.211 | ||
| 2 spectra, QDTLALR | 0.000 | 0.000 | 0.000 | 0.000 | 0.000 | 0.000 | 0.710 | 0.290 | ||
| 4 spectra, SGSVVSENTACR | 0.000 | 0.000 | 0.000 | 0.000 | 0.000 | 0.000 | 0.535 | 0.465 | ||
| 2 spectra, EEHVELPNLSATDAR | 0.000 | 0.000 | 0.000 | 0.000 | 0.000 | 0.000 | 0.517 | 0.483 | ||
| 2 spectra, HPLLGDLR | 0.000 | 0.000 | 0.000 | 0.000 | 0.000 | 0.000 | 0.630 | 0.370 | ||
| 3 spectra, FLHDNIIEFAK | 0.000 | 0.000 | 0.000 | 0.000 | 0.000 | 0.000 | 0.564 | 0.436 | ||
| 4 spectra, HLIELLK | 0.000 | 0.000 | 0.000 | 0.000 | 0.000 | 0.000 | 0.621 | 0.379 | ||
| 3 spectra, TPATAEAQHVIYEMK | 0.000 | 0.000 | 0.000 | 0.000 | 0.000 | 0.000 | 0.510 | 0.490 | ||
| 2 spectra, IKPPMCFTK | 0.000 | 0.000 | 0.000 | 0.000 | 0.000 | 0.000 | 0.768 | 0.232 | ||
| 2 spectra, QMELLNTNSR | 0.000 | 0.000 | 0.000 | 0.000 | 0.000 | 0.000 | 0.591 | 0.409 | ||
| 2 spectra, ENLQGNAVR | 0.000 | 0.000 | 0.000 | 0.000 | 0.000 | 0.000 | 0.734 | 0.266 | ||
| 1 spectrum, IFFAADPIK | 0.000 | 0.000 | 0.000 | 0.000 | 0.000 | 0.000 | 0.458 | 0.542 |
| Plot | Mito | Lyso or Perox | ER | Golgi | PM | Cytosol | Nucleus | ||||||
| Expt B |
4 peptides |
6 spectra |
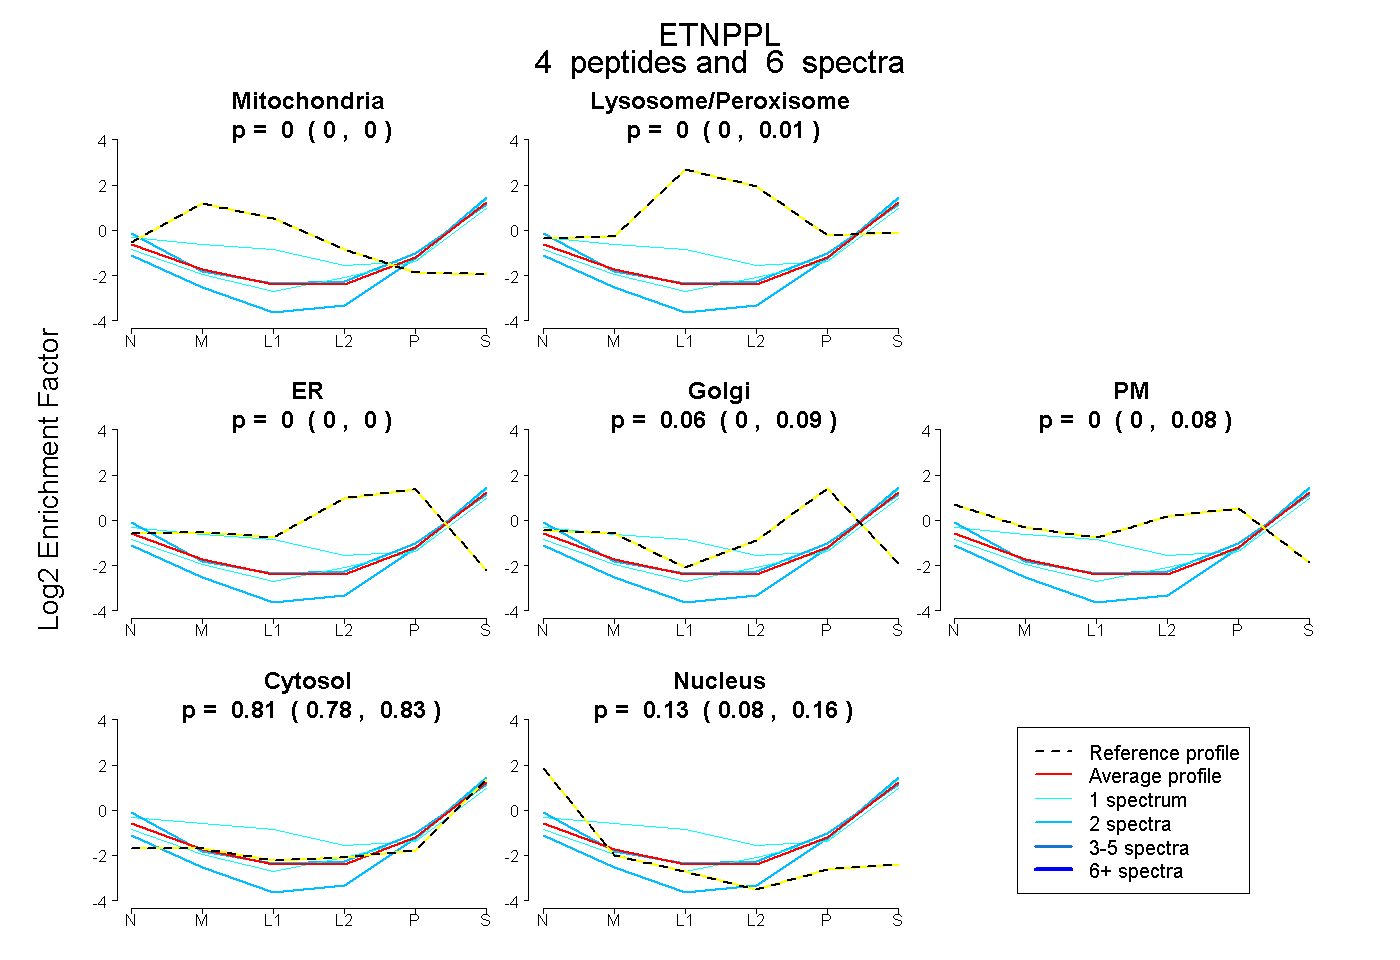 |
0.000 0.000 | 0.000 |
0.000 0.000 | 0.007 |
0.000 0.000 | 0.000 |
0.065 0.000 | 0.086 |
0.000 0.000 | 0.084 |
0.809 0.780 | 0.832 |
0.126 0.080 | 0.159 |
|||
| Plot | Lyso | Other | |||||||||||
| Expt C |
1 peptide |
1 spectrum |
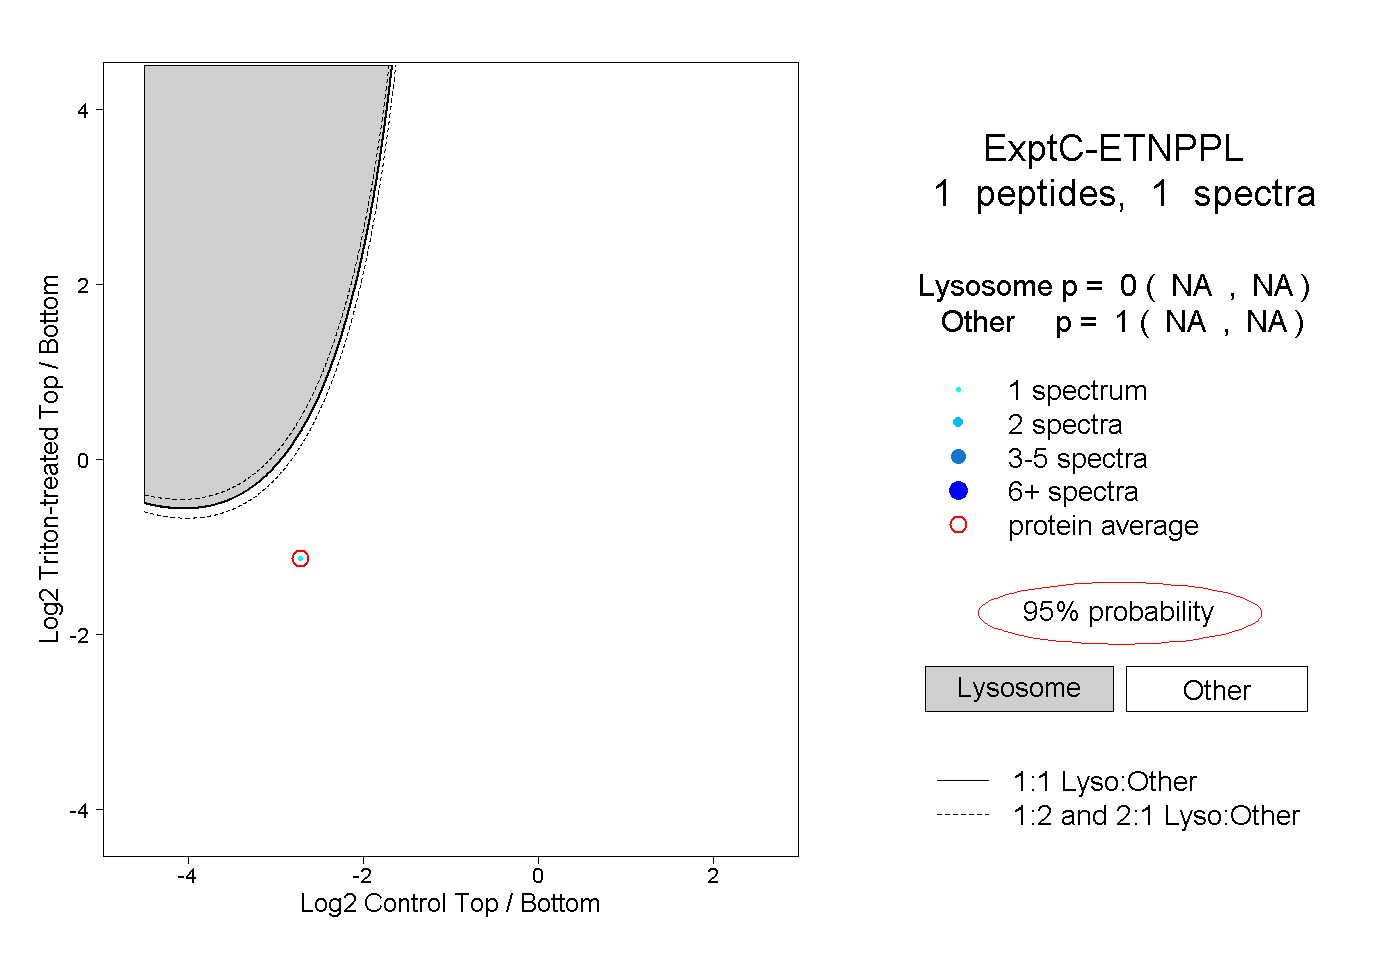 |
0.000 NA | NA |
1.000 NA | NA |