ETNPPL
[ENSRNOP00000065383]
Main page
| | | Plot |
Mito |
Lyso |
|
Perox |
ER |
Golgi |
PM |
Cytosol |
Nucleus |
|
| Expt A |
 12
12
peptides |
30
spectra |
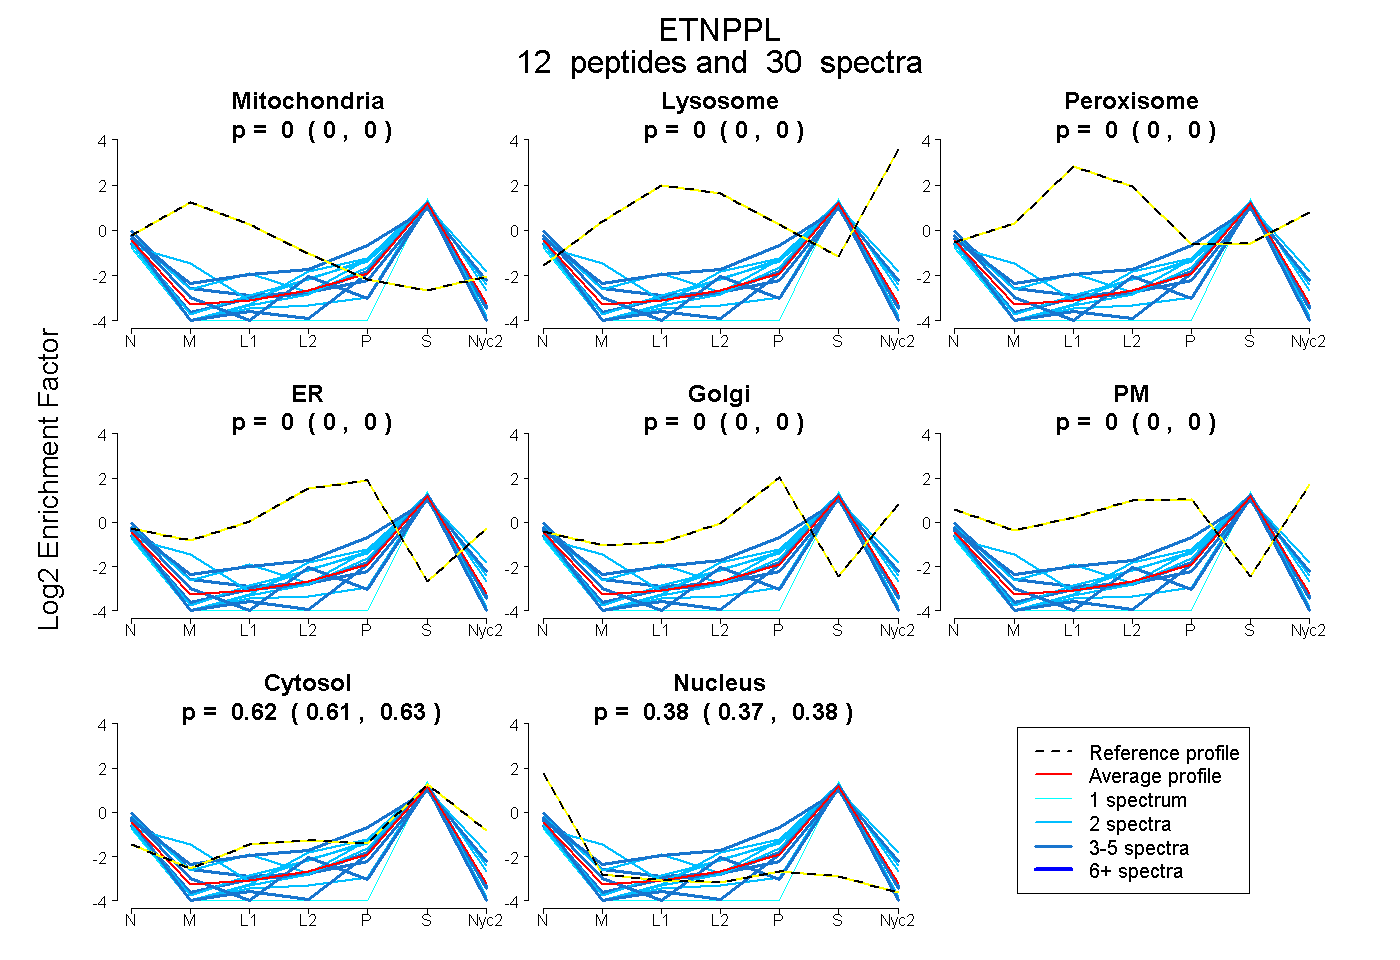 |
0.000
0.000 | 0.000 |
0.000
0.000 | 0.000 |
|
0.000
0.000 | 0.000 |
0.000
0.000 | 0.000 |
0.000
0.000 | 0.000 |
0.000
0.000 | 0.000 |
0.622
0.614 | 0.628 |
0.378
0.370 | 0.384 |
|
| | | Plot |
Mito |
|
Lyso or Perox |
|
ER |
Golgi |
PM |
Cytosol |
Nucleus |
|
| Expt B |
4
peptides |
6
spectra |
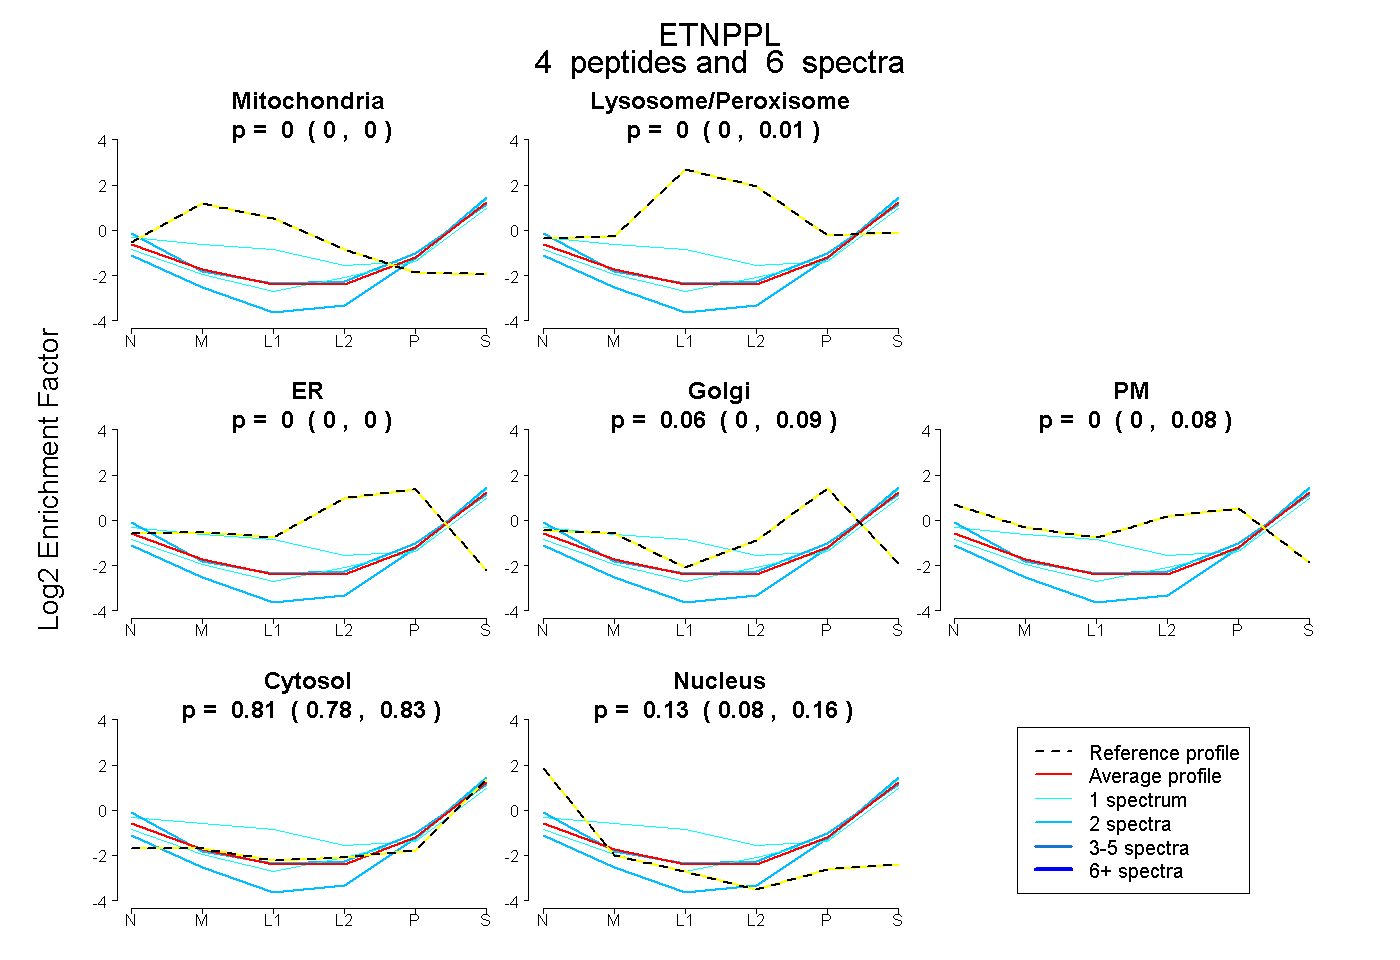 |
0.000
0.000 | 0.000 |
|
0.000
0.000 | 0.007 |
|
0.000
0.000 | 0.000 |
0.065
0.000 | 0.086 |
0.000
0.000 | 0.084 |
0.809
0.780 | 0.832 |
0.126
0.080 | 0.159 |
|
| 2 spectra, QDTLALR |
0.000 |
|
0.000 |
|
0.000 |
0.040 |
0.071 |
0.729 |
0.160 |
|
| 1 spectrum, HPLLGDLR |
0.094 |
|
0.218 |
|
0.000 |
0.000 |
0.000 |
0.585 |
0.103 |
|
| 2 spectra, FLHDNIIEFAK |
0.000 |
|
0.000 |
|
0.000 |
0.000 |
0.000 |
0.864 |
0.136 |
|
| 1 spectrum, QMELLNTNSR |
0.000 |
|
0.000 |
|
0.000 |
0.039 |
0.000 |
0.876 |
0.085 |
|
| | | Plot |
|
Lyso |
|
|
|
|
|
|
|
Other |
| Expt C |
1
peptide |
1
spectrum |
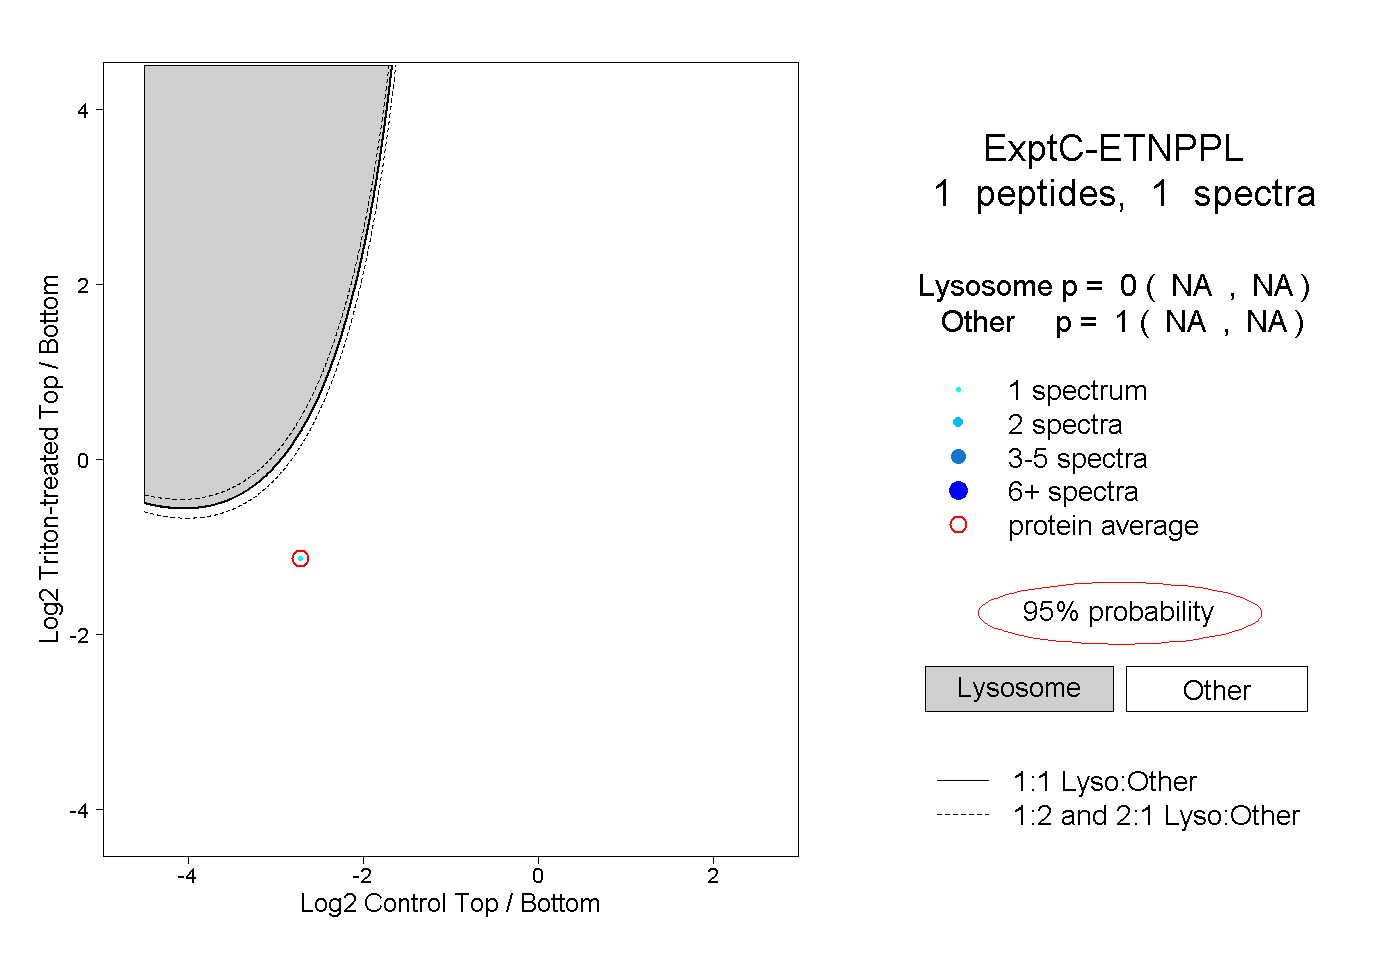 |
|
0.000
NA | NA |
|
|
|
|
|
|
|
1.000
NA | NA |