 6
6peptides
spectra
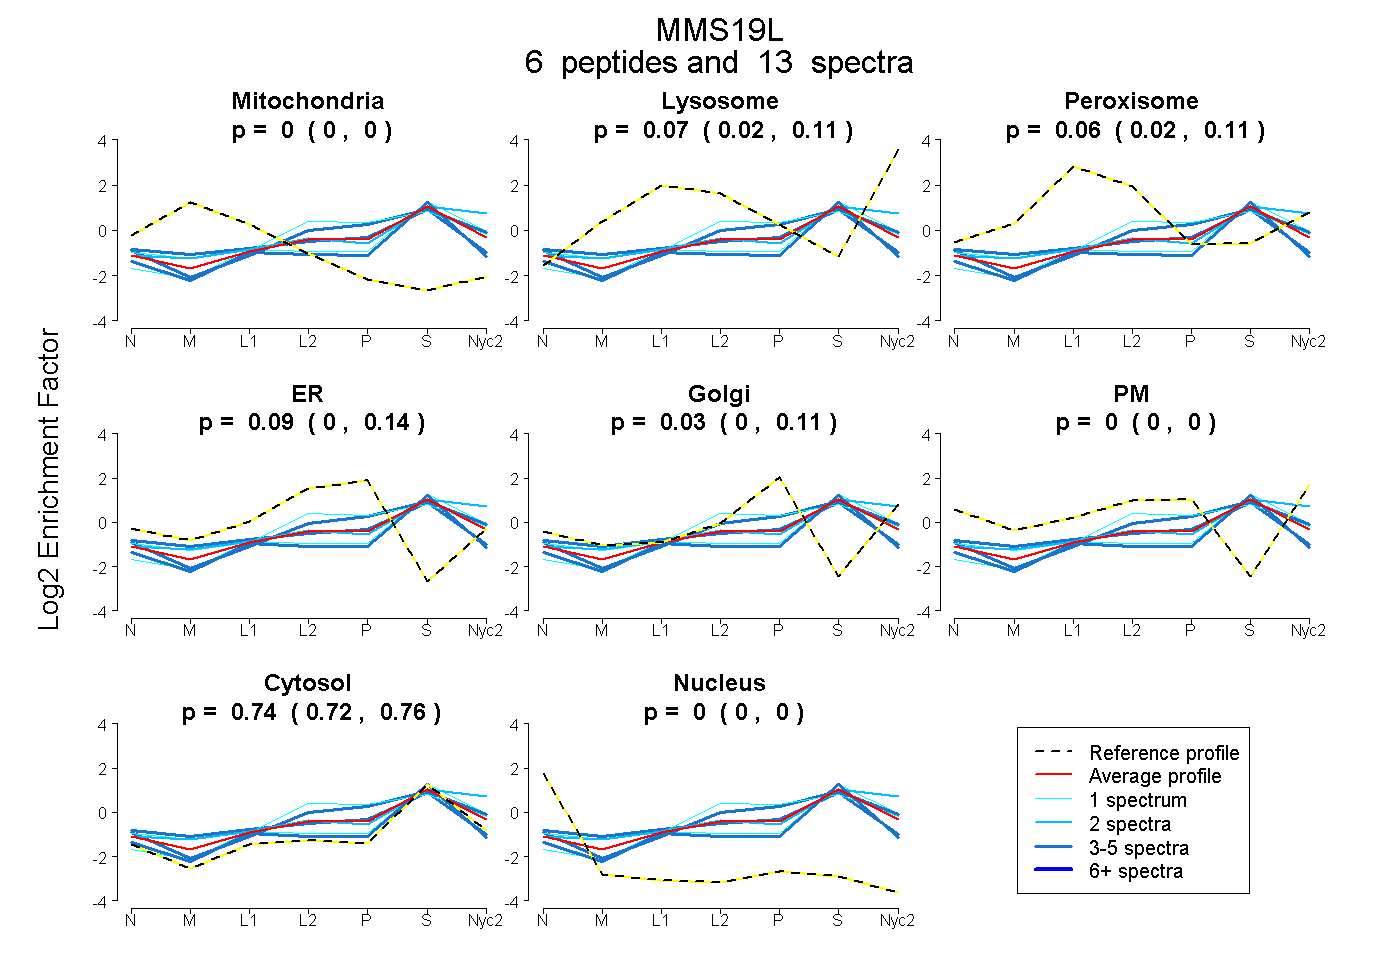
0.000 | 0.000
0.018 | 0.111
0.020 | 0.110
0.000 | 0.136
0.000 | 0.115
0.000 | 0.000
0.717 | 0.755
0.000 | 0.000
3peptides
spectra
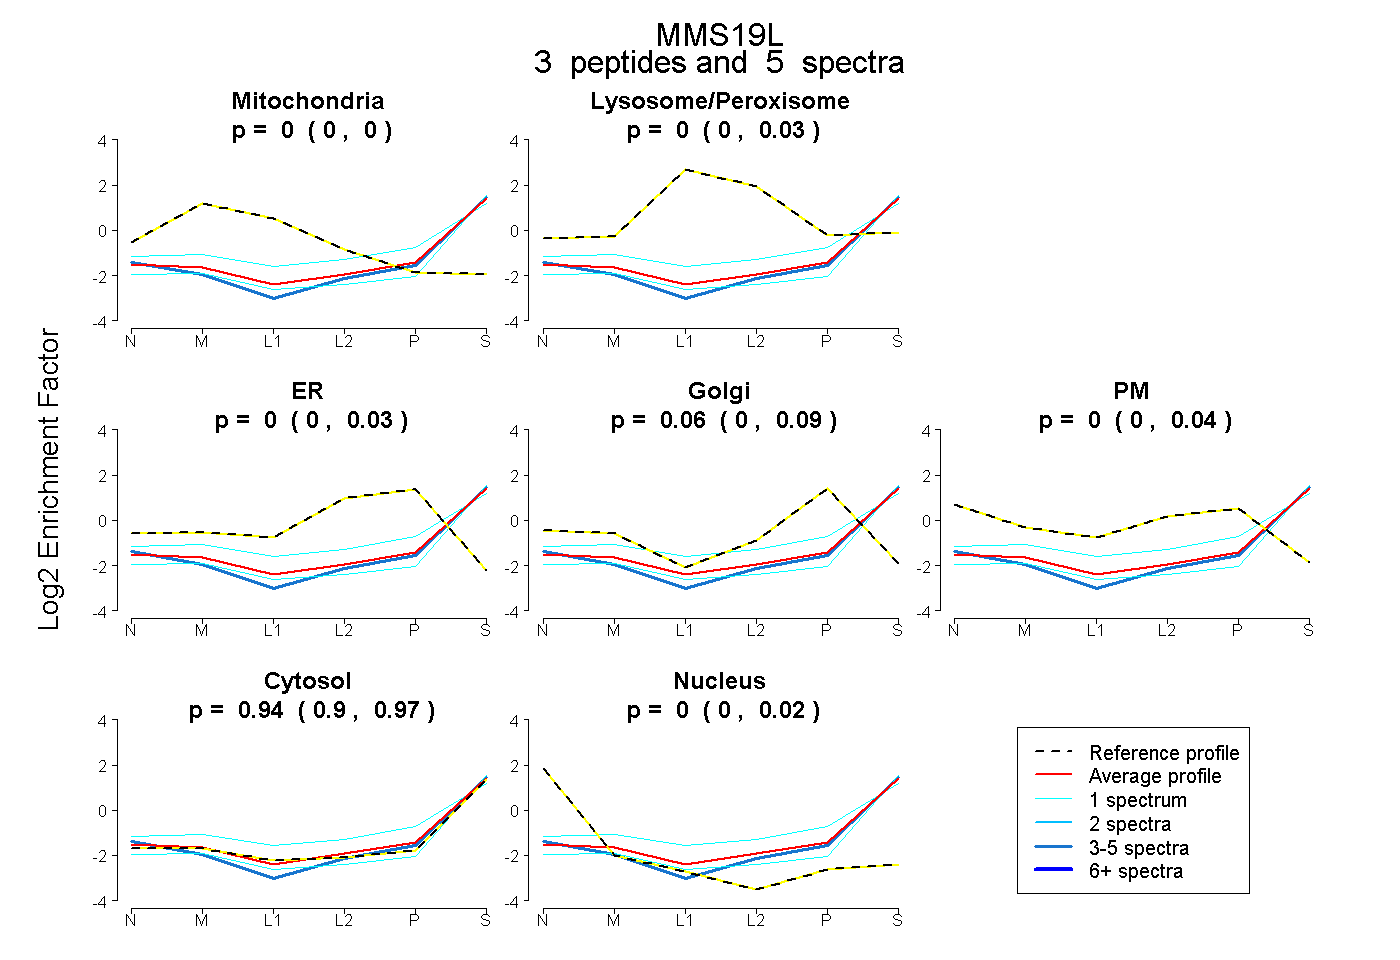
0.000 | 0.000
0.000 | 0.026
0.000 | 0.033
0.000 | 0.090
0.000 | 0.039
0.897 | 0.973
0.000 | 0.024
1peptide
spectrum
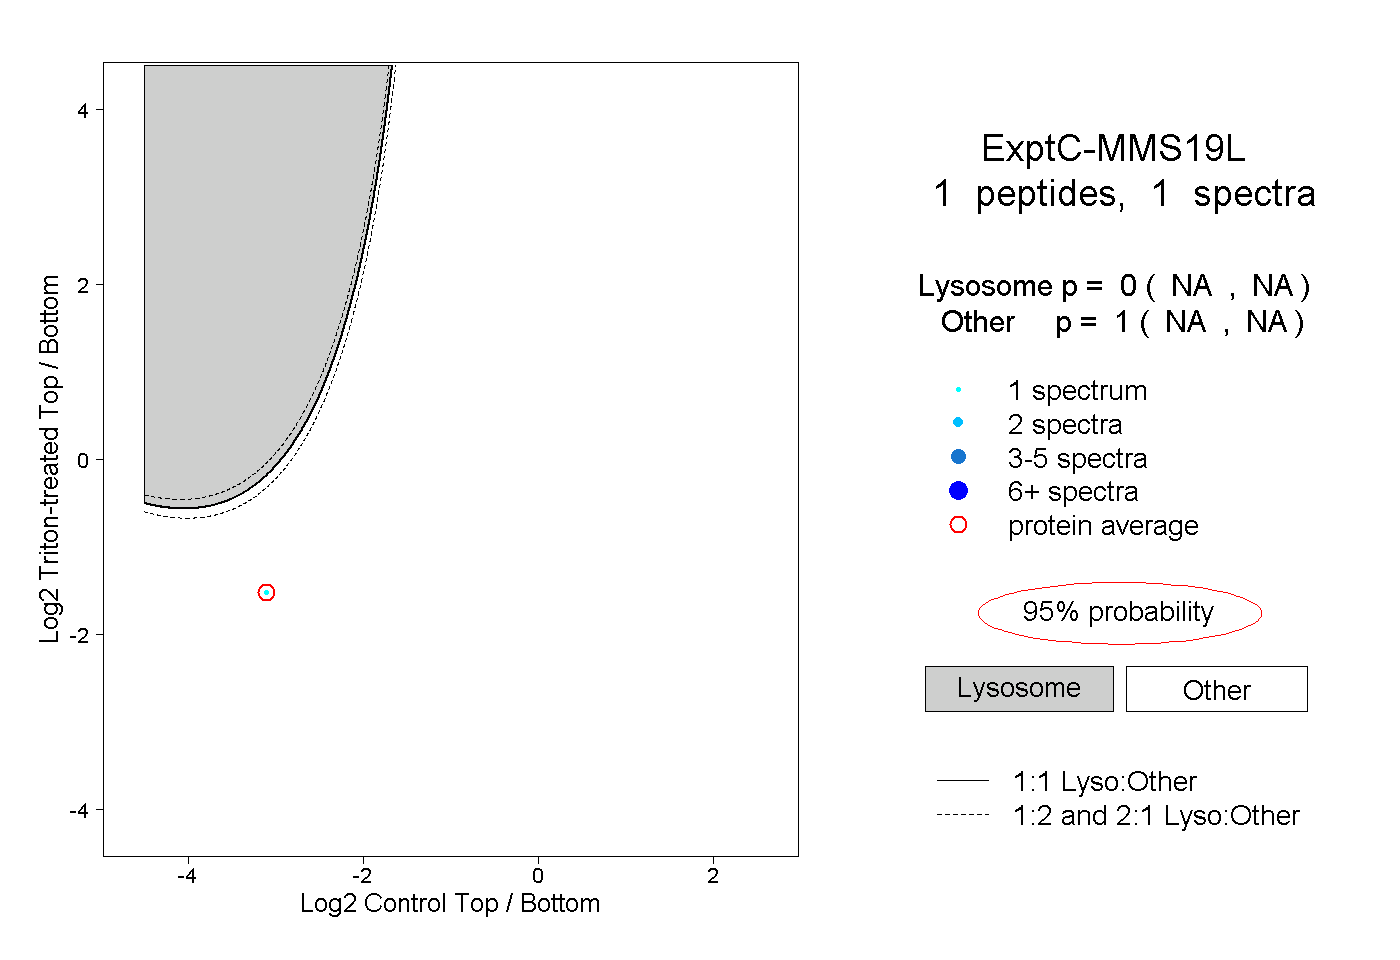
NA | NA
NA | NA