 6
6peptides
spectra
0.000 | 0.000
0.018 | 0.111
0.020 | 0.110
0.000 | 0.136
0.000 | 0.115
0.000 | 0.000
0.717 | 0.755
0.000 | 0.000
| Plot | Mito | Lyso | Perox | ER | Golgi | PM | Cytosol | Nucleus | |||||
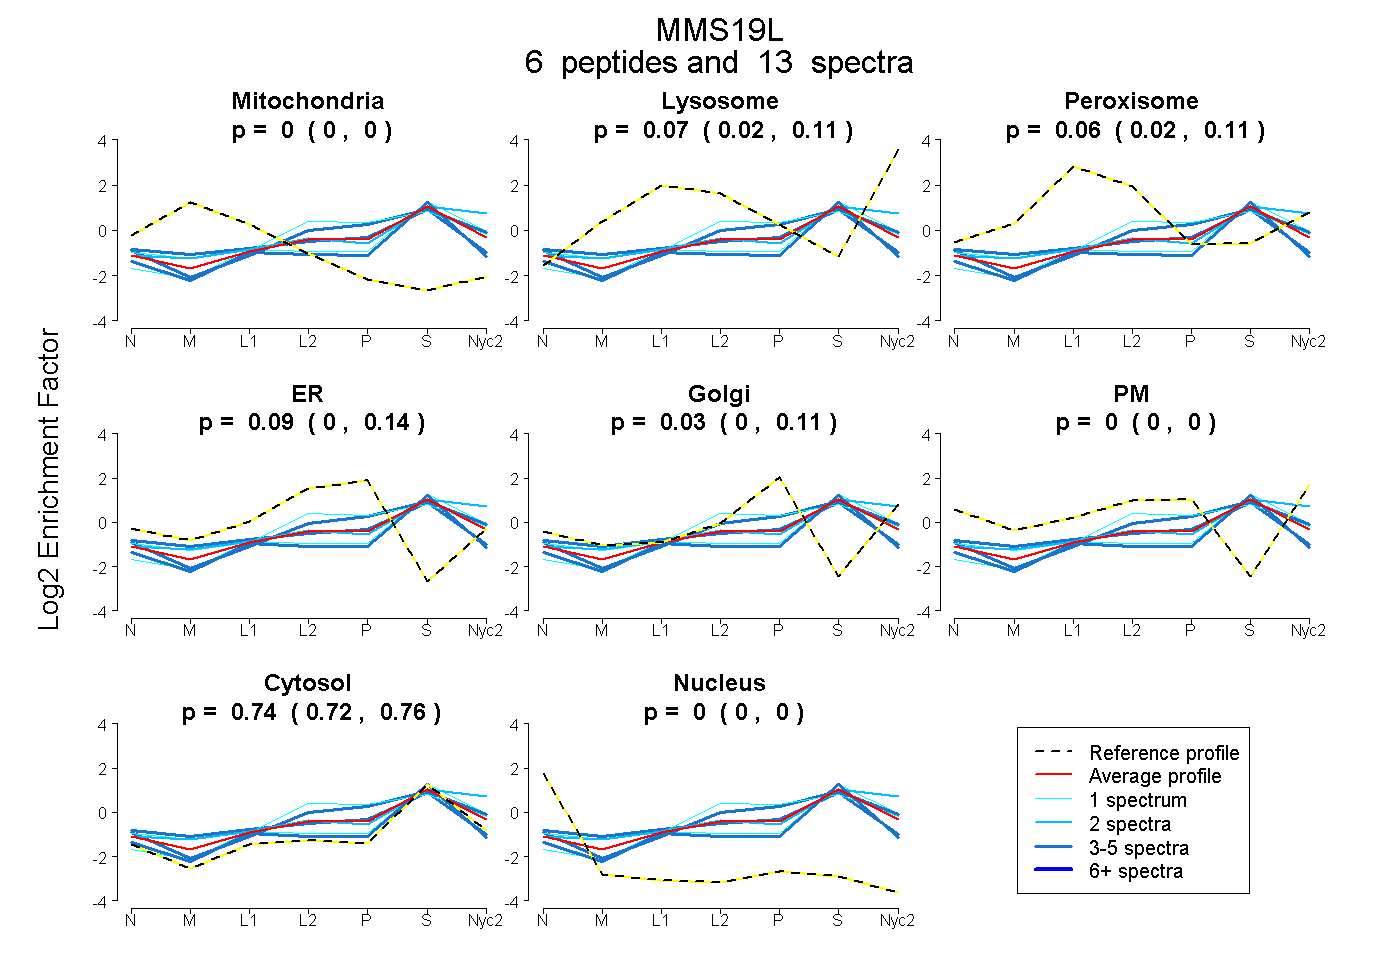
| Expt A |
6 peptides |
13 spectra |
|
0.000 0.000 | 0.000 |
0.074 0.018 | 0.111 |
0.061 0.020 | 0.110 |
0.093 0.000 | 0.136 |
0.031 0.000 | 0.115 |
0.000 0.000 | 0.000 |
0.741 0.717 | 0.755 |
0.000 0.000 | 0.000 |
| 1 spectrum, AVLASTPR | 0.000 | 0.146 | 0.000 | 0.000 | 0.000 | 0.000 | 0.854 | 0.000 | ||
| 1 spectrum, LAEGLHQGESDVAR | 0.000 | 0.101 | 0.037 | 0.276 | 0.000 | 0.000 | 0.586 | 0.000 | ||
| 3 spectra, LSLLEEDAQSCR | 0.019 | 0.000 | 0.059 | 0.009 | 0.000 | 0.000 | 0.913 | 0.000 | ||
| 2 spectra, LLQAAAGASAR | 0.000 | 0.279 | 0.000 | 0.000 | 0.000 | 0.033 | 0.688 | 0.000 | ||
| 3 spectra, EVFQTASER | 0.000 | 0.072 | 0.000 | 0.182 | 0.069 | 0.000 | 0.677 | 0.000 | ||
| 3 spectra, IAALQCMHALTR | 0.053 | 0.000 | 0.111 | 0.157 | 0.000 | 0.000 | 0.680 | 0.000 |
| Plot | Mito | Lyso or Perox | ER | Golgi | PM | Cytosol | Nucleus | ||||||
| Expt B |
3 peptides |
5 spectra |
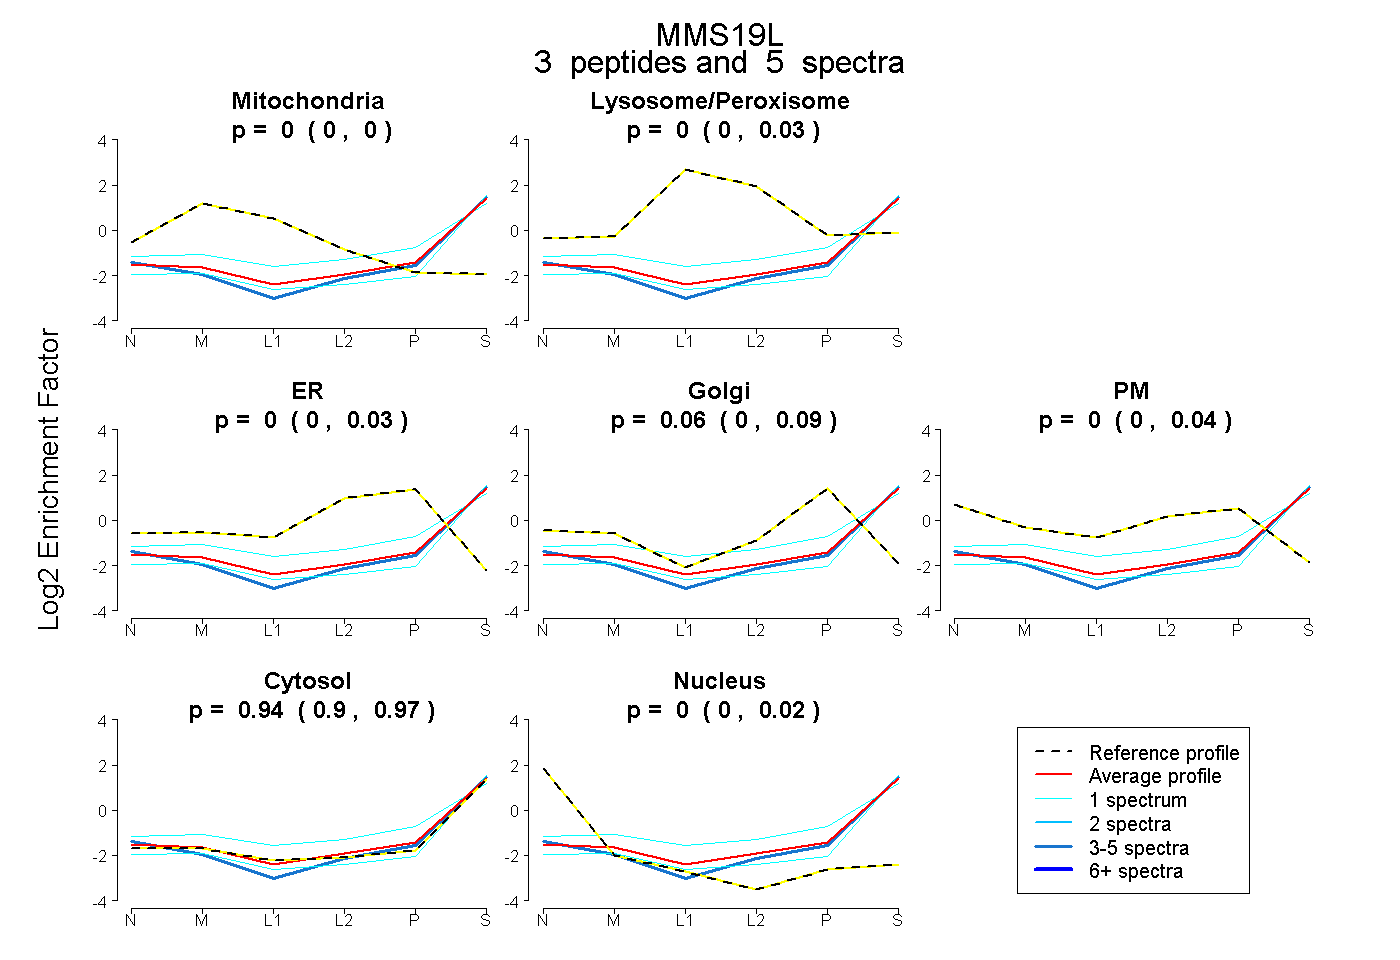 |
0.000 0.000 | 0.000 |
0.000 0.000 | 0.026 |
0.000 0.000 | 0.033 |
0.057 0.000 | 0.090 |
0.000 0.000 | 0.039 |
0.943 0.897 | 0.973 |
0.000 0.000 | 0.024 |
|||
| Plot | Lyso | Other | |||||||||||
| Expt C |
1 peptide |
1 spectrum |
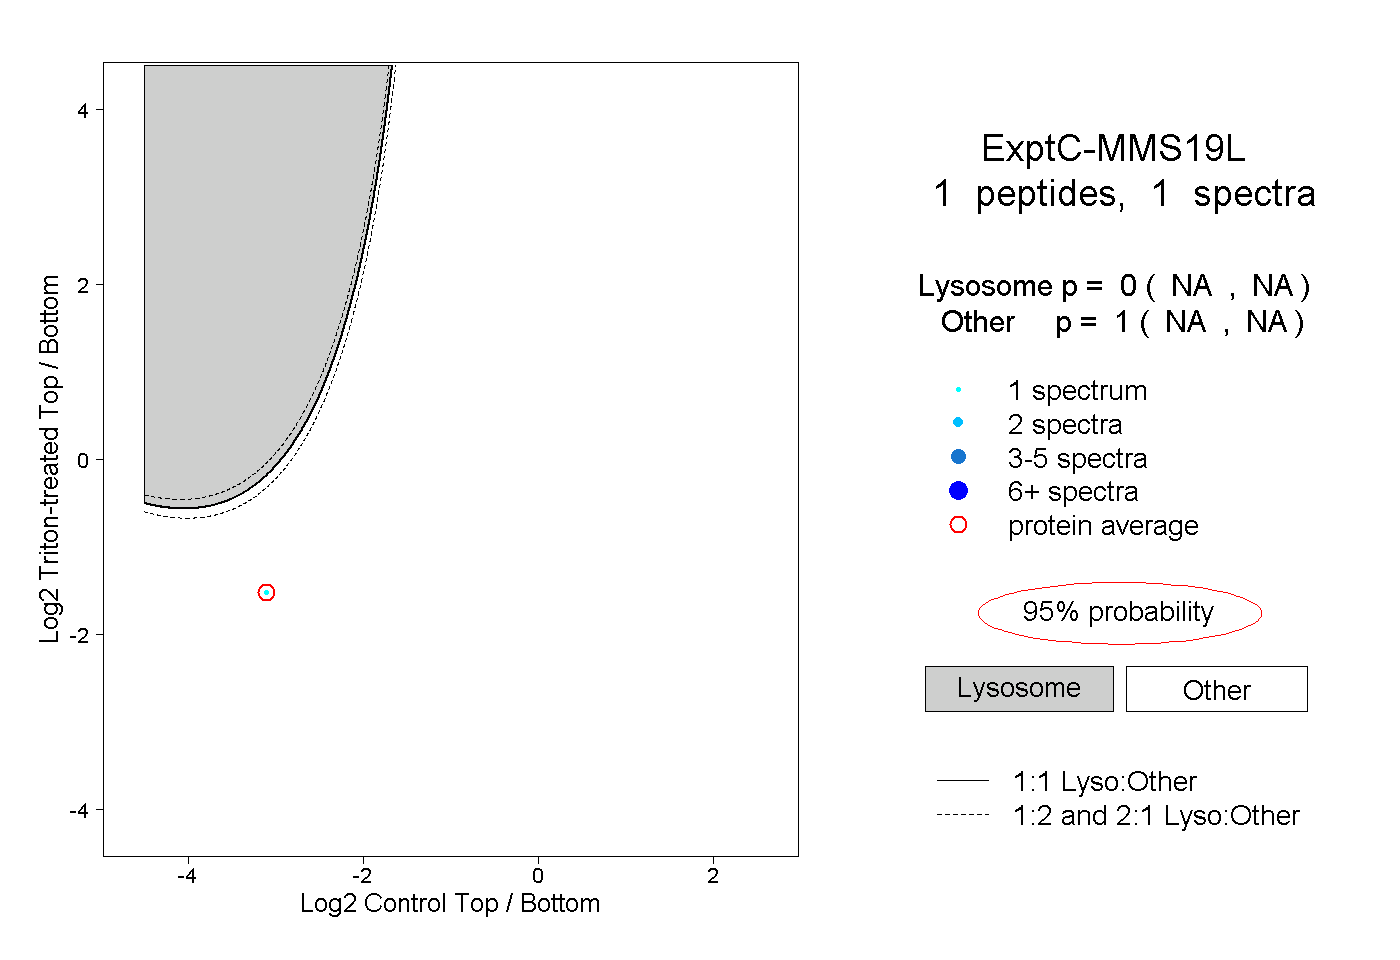 |
0.000 NA | NA |
1.000 NA | NA |