MMS19L
[ENSRNOP00000065140]
Main page
| | | Plot |
Mito |
Lyso |
|
Perox |
ER |
Golgi |
PM |
Cytosol |
Nucleus |
|
| Expt A |
 6
6
peptides |
13
spectra |
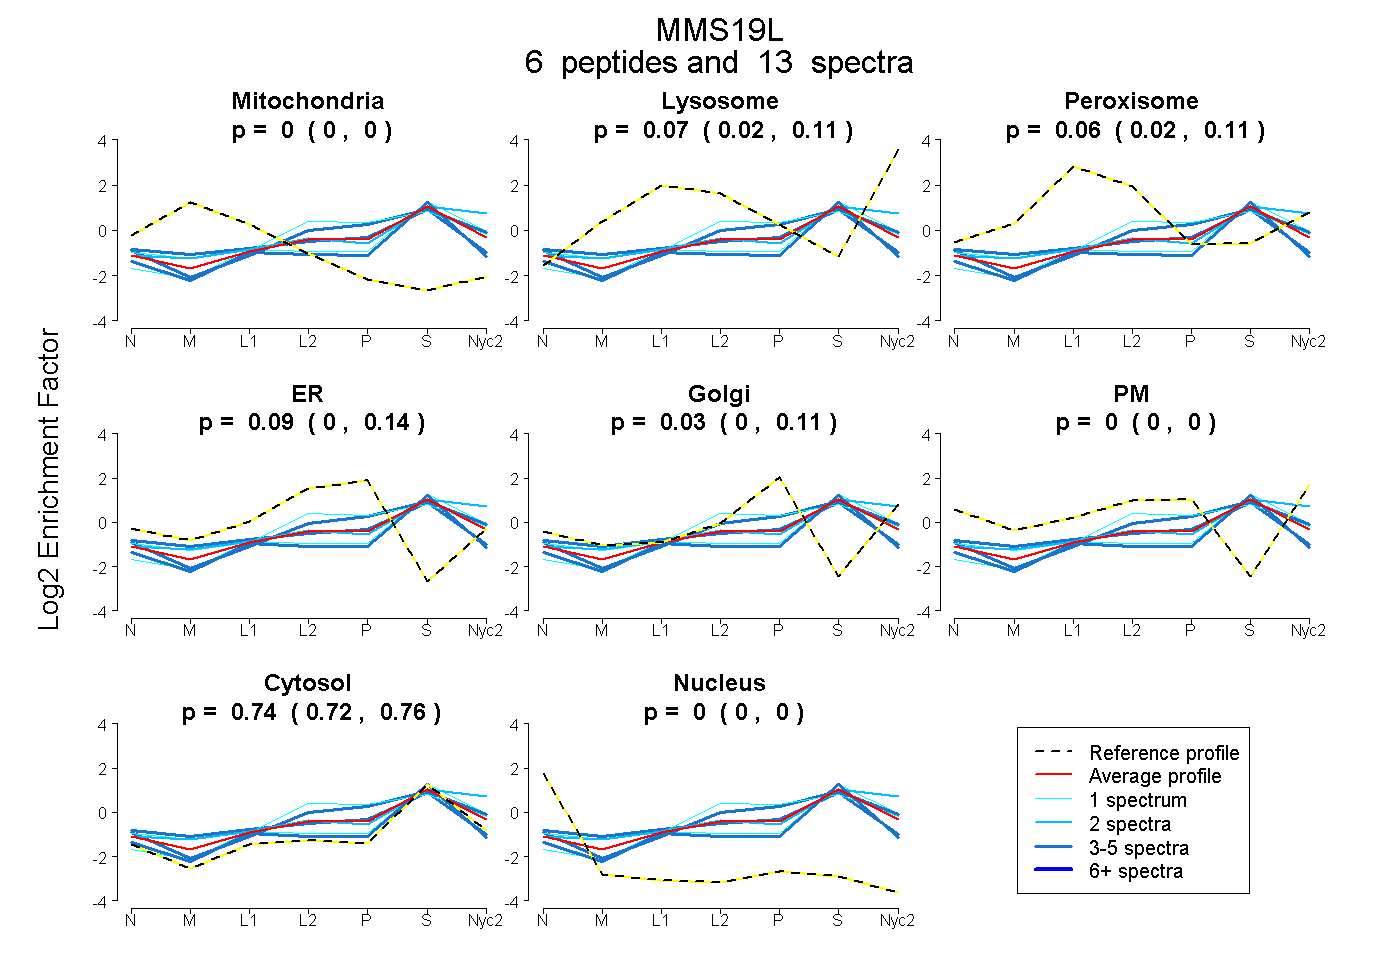 |
0.000
0.000 | 0.000 |
0.074
0.018 | 0.111 |
|
0.061
0.020 | 0.110 |
0.093
0.000 | 0.136 |
0.031
0.000 | 0.115 |
0.000
0.000 | 0.000 |
0.741
0.717 | 0.755 |
0.000
0.000 | 0.000 |
|
| | | Plot |
Mito |
|
Lyso or Perox |
|
ER |
Golgi |
PM |
Cytosol |
Nucleus |
|
| Expt B |
3
peptides |
5
spectra |
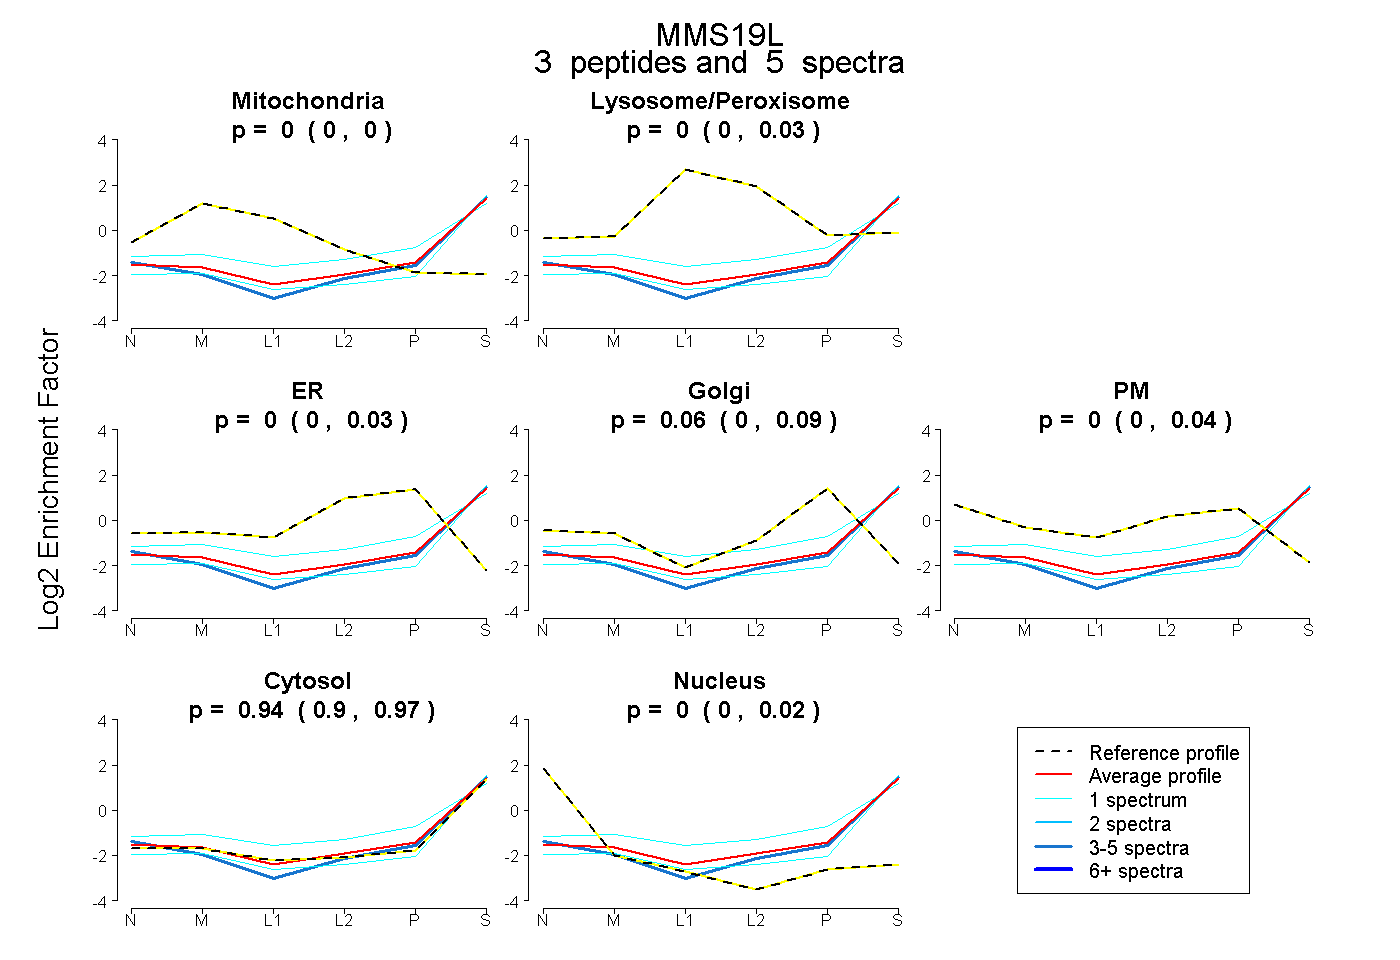 |
0.000
0.000 | 0.000 |
|
0.000
0.000 | 0.026 |
|
0.000
0.000 | 0.033 |
0.057
0.000 | 0.090 |
0.000
0.000 | 0.039 |
0.943
0.897 | 0.973 |
0.000
0.000 | 0.024 |
|
| 3 spectra, LLQAAAGASAR |
0.000 |
|
0.000 |
|
0.000 |
0.000 |
0.000 |
0.962 |
0.038 |
|
| 1 spectrum, NLLLAFR |
0.000 |
|
0.000 |
|
0.000 |
0.000 |
0.000 |
1.000 |
0.000 |
|
| 1 spectrum, EVFQTASER |
0.000 |
|
0.149 |
|
0.000 |
0.143 |
0.000 |
0.709 |
0.000 |
|
| | | Plot |
|
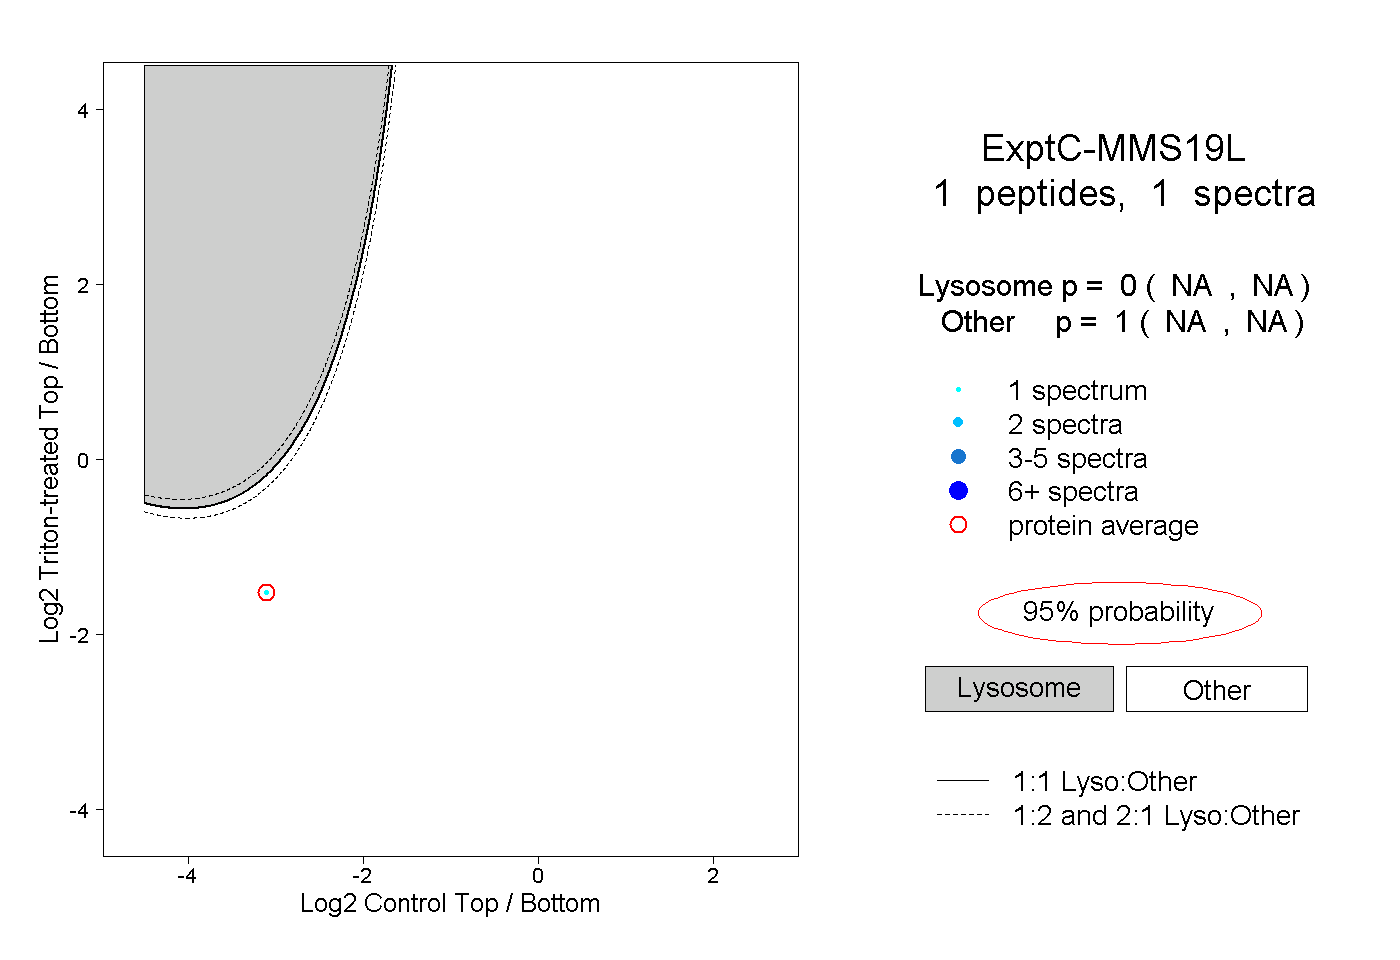
Lyso |
|
|
|
|
|
|
|
Other |
| Expt C |
1
peptide |
1
spectrum |
 |
|
0.000
NA | NA |
|
|
|
|
|
|
|
1.000
NA | NA |