 14
14peptides
spectra
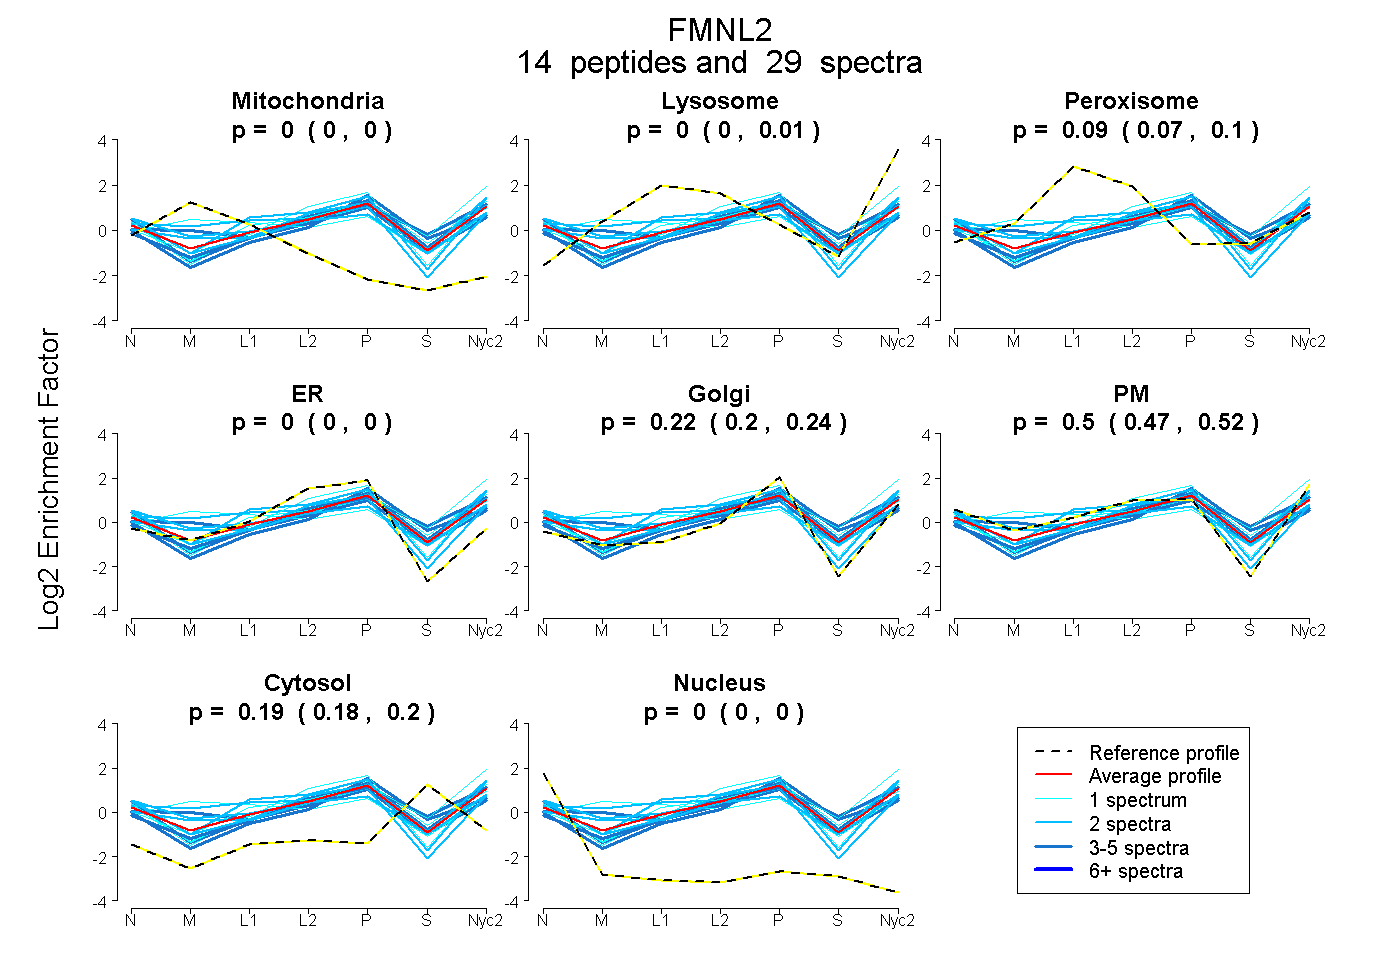
0.000 | 0.000
0.000 | 0.013
0.075 | 0.101
0.000 | 0.000
0.201 | 0.237
0.475 | 0.516
0.178 | 0.196
0.000 | 0.000
1peptide
spectrum
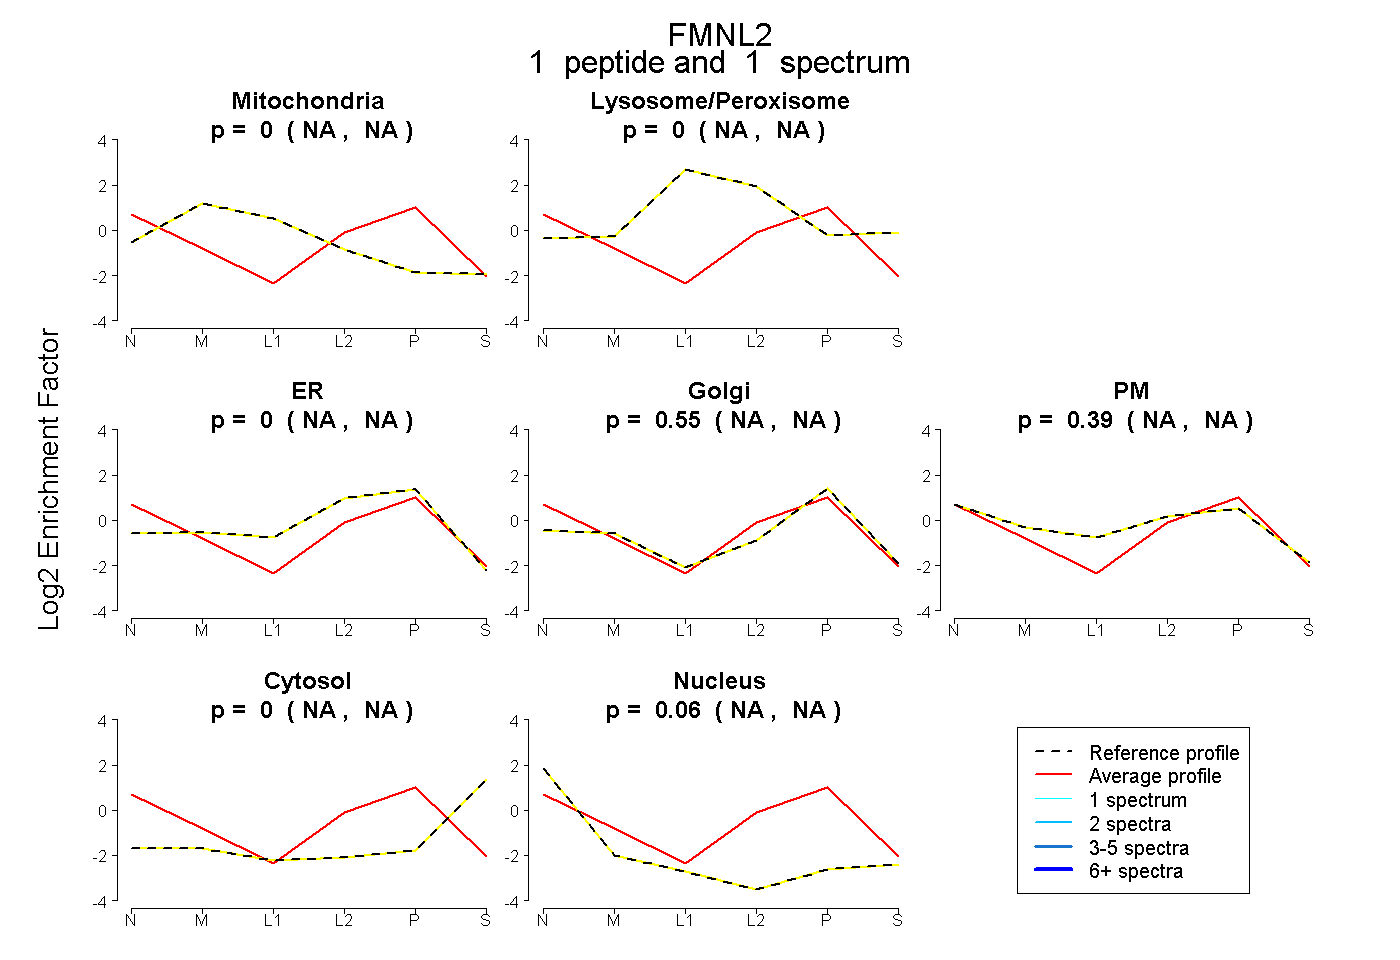
NA | NA
NA | NA
NA | NA
NA | NA
NA | NA
NA | NA
NA | NA
12peptides
spectra
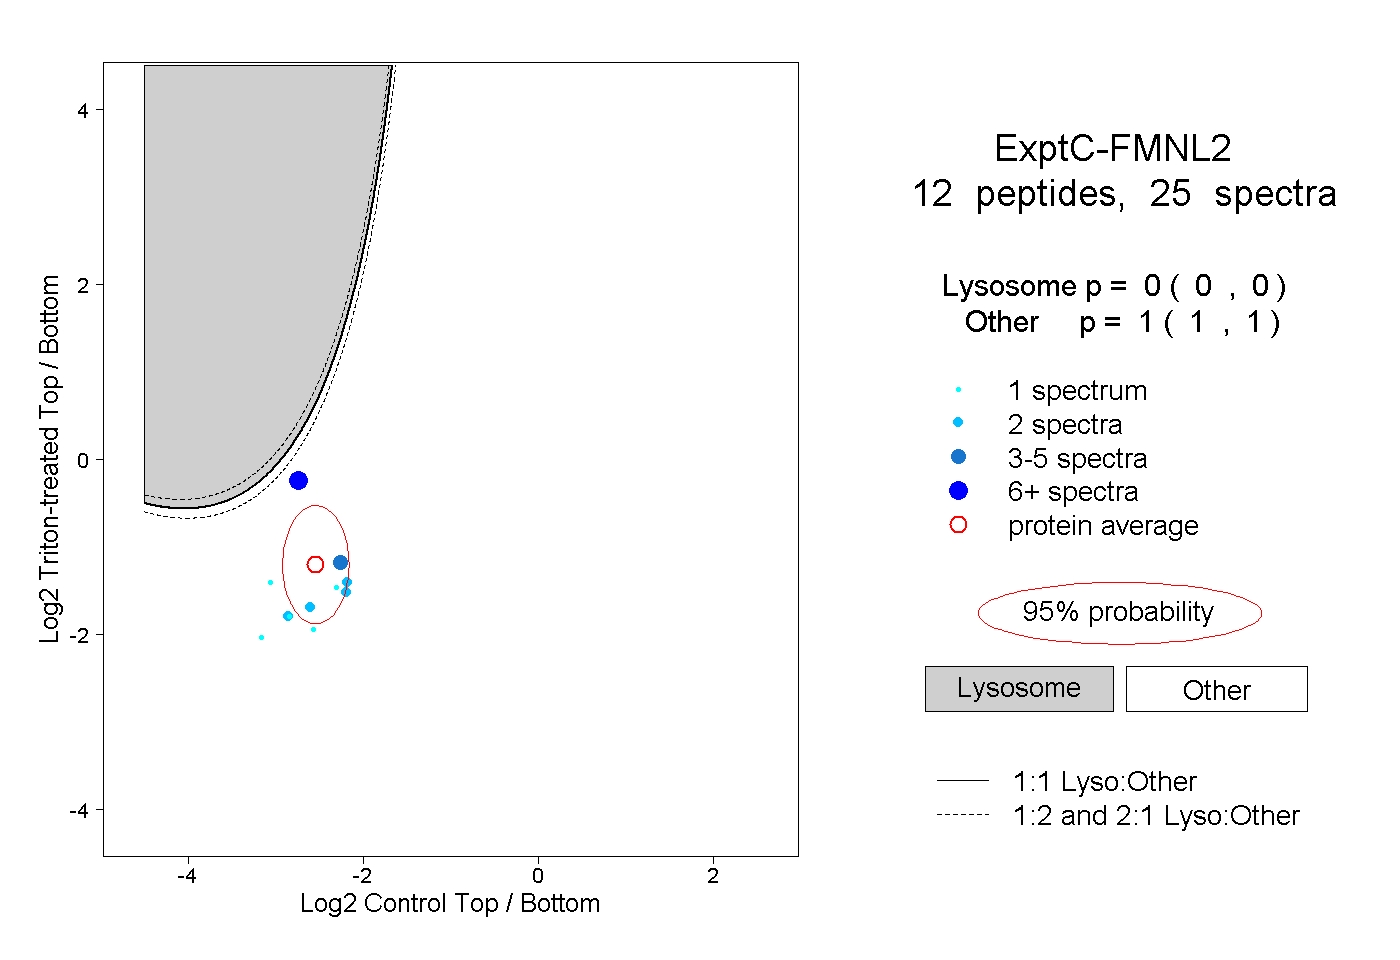
0.000 | 0.000
1.000 | 1.000