 14
14peptides
spectra
0.000 | 0.000
0.000 | 0.013
0.075 | 0.101
0.000 | 0.000
0.201 | 0.237
0.475 | 0.516
0.178 | 0.196
0.000 | 0.000
| Plot | Mito | Lyso | Perox | ER | Golgi | PM | Cytosol | Nucleus | |||||
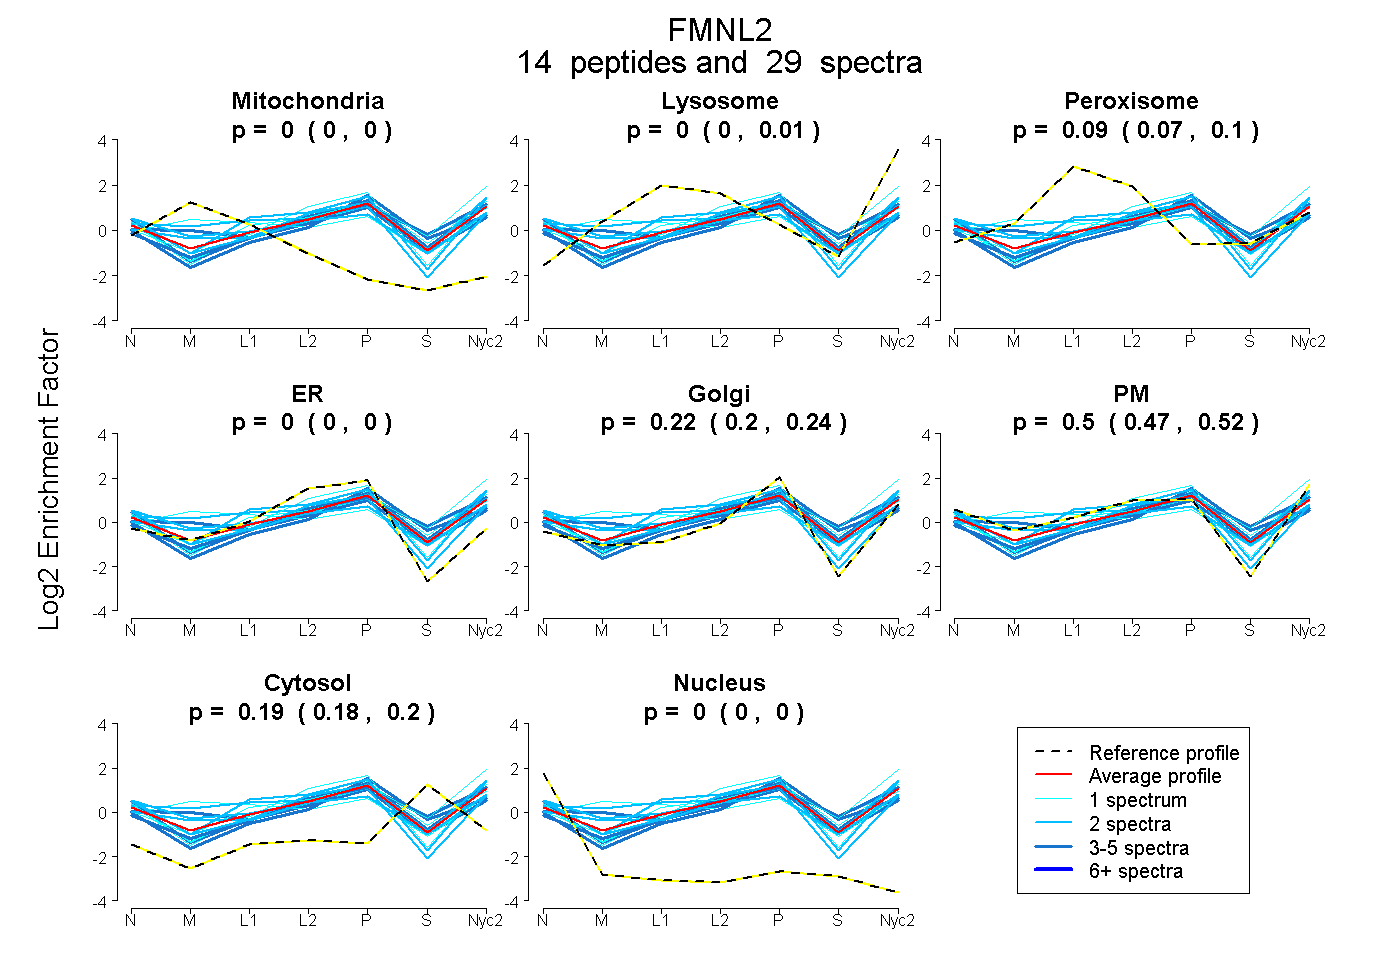
| Expt A |
14 peptides |
29 spectra |
|
0.000 0.000 | 0.000 |
0.003 0.000 | 0.013 |
0.089 0.075 | 0.101 |
0.000 0.000 | 0.000 |
0.220 0.201 | 0.237 |
0.499 0.475 | 0.516 |
0.188 0.178 | 0.196 |
0.000 0.000 | 0.000 |
| 2 spectra, NPPHTYIQK | 0.000 | 0.066 | 0.062 | 0.000 | 0.304 | 0.391 | 0.176 | 0.000 | ||
| 3 spectra, AIHVFDLK | 0.052 | 0.000 | 0.164 | 0.000 | 0.380 | 0.258 | 0.147 | 0.000 | ||
| 1 spectrum, LVEIEK | 0.000 | 0.269 | 0.000 | 0.000 | 0.121 | 0.388 | 0.221 | 0.000 | ||
| 2 spectra, TNHIGWVR | 0.029 | 0.000 | 0.067 | 0.000 | 0.000 | 0.695 | 0.209 | 0.000 | ||
| 2 spectra, GAVYGFK | 0.116 | 0.000 | 0.128 | 0.058 | 0.203 | 0.494 | 0.000 | 0.000 | ||
| 4 spectra, LMEHFR | 0.000 | 0.153 | 0.000 | 0.056 | 0.172 | 0.310 | 0.308 | 0.000 | ||
| 1 spectrum, DGAIEDIITALK | 0.168 | 0.110 | 0.182 | 0.000 | 0.274 | 0.194 | 0.072 | 0.000 | ||
| 4 spectra, DGAIEDIITDLR | 0.000 | 0.000 | 0.000 | 0.000 | 0.164 | 0.594 | 0.241 | 0.000 | ||
| 1 spectrum, AAAVSLENVLLDVK | 0.000 | 0.040 | 0.000 | 0.000 | 0.183 | 0.525 | 0.252 | 0.000 | ||
| 1 spectrum, EFLNEENK | 0.000 | 0.007 | 0.025 | 0.000 | 0.082 | 0.552 | 0.333 | 0.000 | ||
| 2 spectra, VTLLEANR | 0.000 | 0.000 | 0.134 | 0.000 | 0.247 | 0.598 | 0.020 | 0.000 | ||
| 3 spectra, ELDVVR | 0.000 | 0.000 | 0.046 | 0.011 | 0.454 | 0.196 | 0.294 | 0.000 | ||
| 2 spectra, NLAITLR | 0.000 | 0.004 | 0.000 | 0.000 | 0.053 | 0.746 | 0.197 | 0.000 | ||
| 1 spectrum, IAQDAFDDVVK | 0.000 | 0.008 | 0.000 | 0.105 | 0.200 | 0.605 | 0.082 | 0.000 |
| Plot | Mito | Lyso or Perox | ER | Golgi | PM | Cytosol | Nucleus | ||||||
| Expt B |
1 peptide |
1 spectrum |
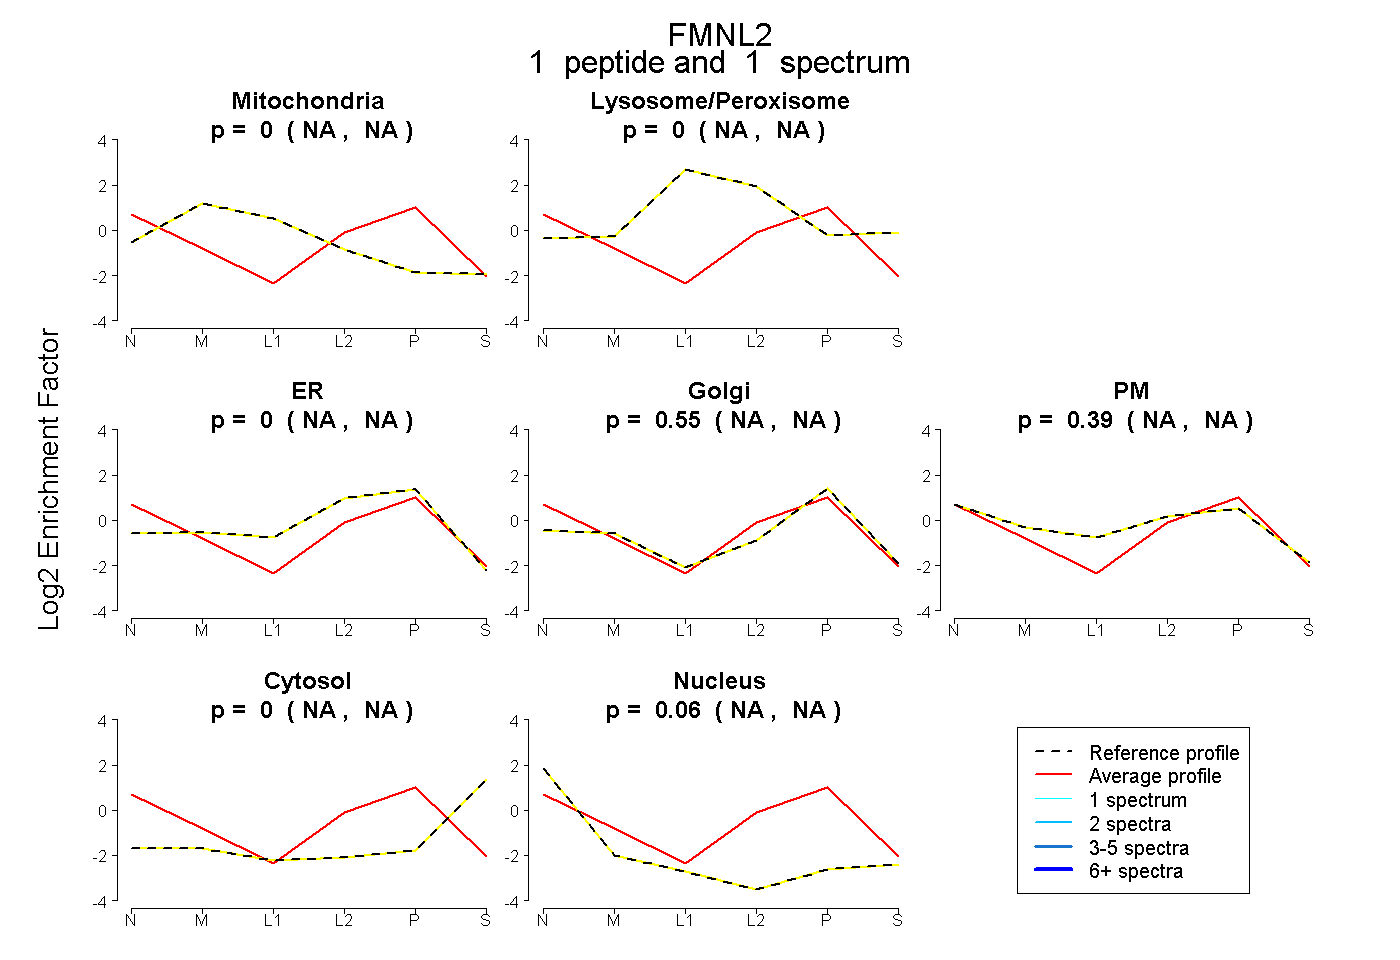 |
0.000 NA | NA |
0.000 NA | NA |
0.000 NA | NA |
0.551 NA | NA |
0.390 NA | NA |
0.000 NA | NA |
0.060 NA | NA |
|||
| Plot | Lyso | Other | |||||||||||
| Expt C |
12 peptides |
25 spectra |
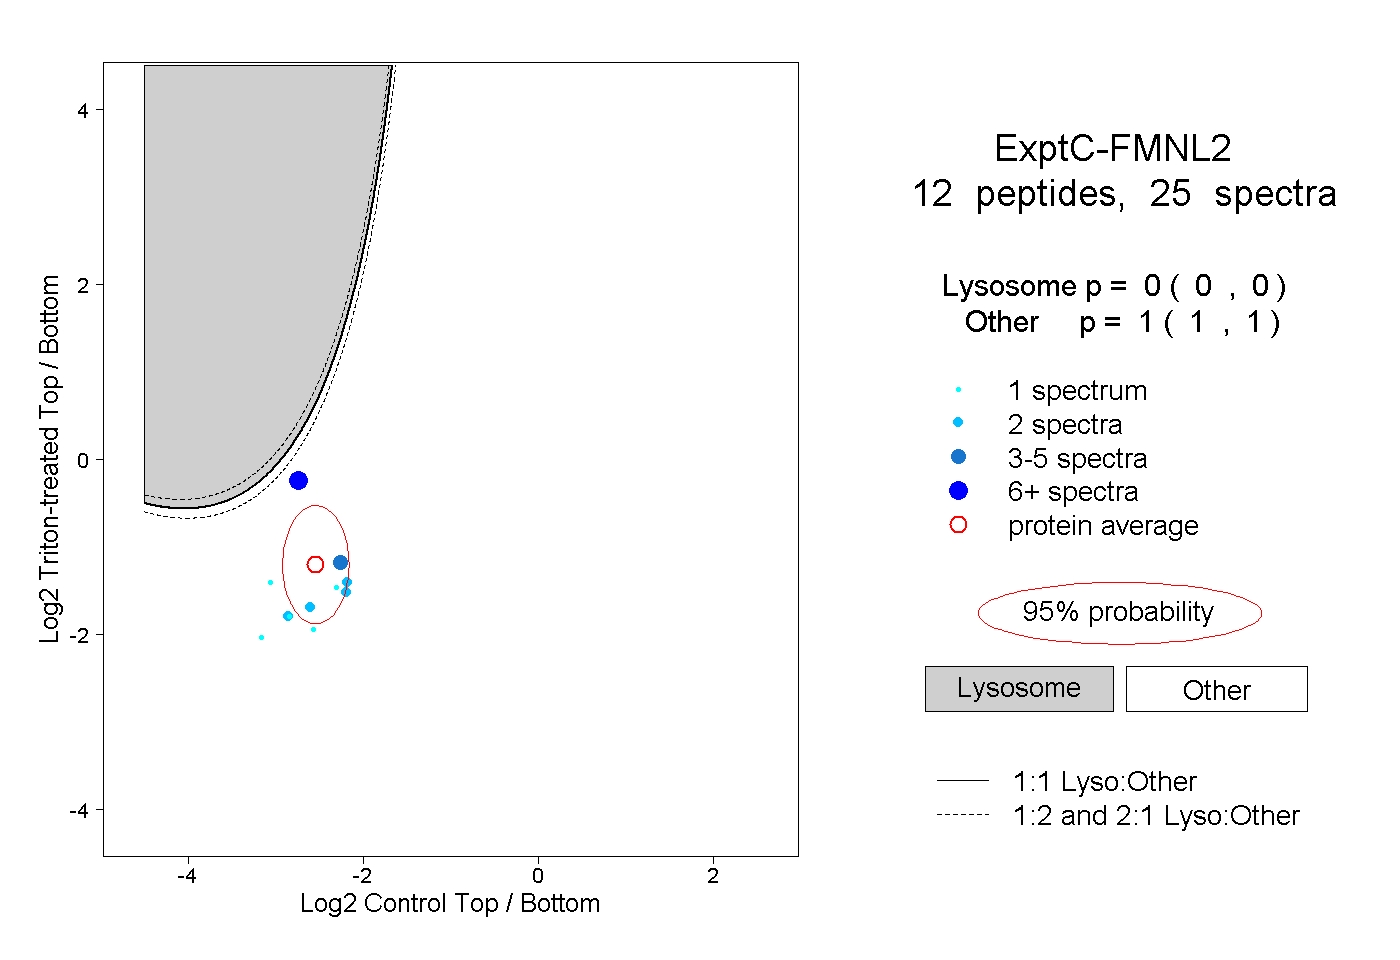 |
0.000 0.000 | 0.000 |
1.000 1.000 | 1.000 |