FMNL2
[ENSRNOP00000064894]
Main page
| | | Plot |
Mito |
Lyso |
|
Perox |
ER |
Golgi |
PM |
Cytosol |
Nucleus |
|
| Expt A |
 14
14
peptides |
29
spectra |
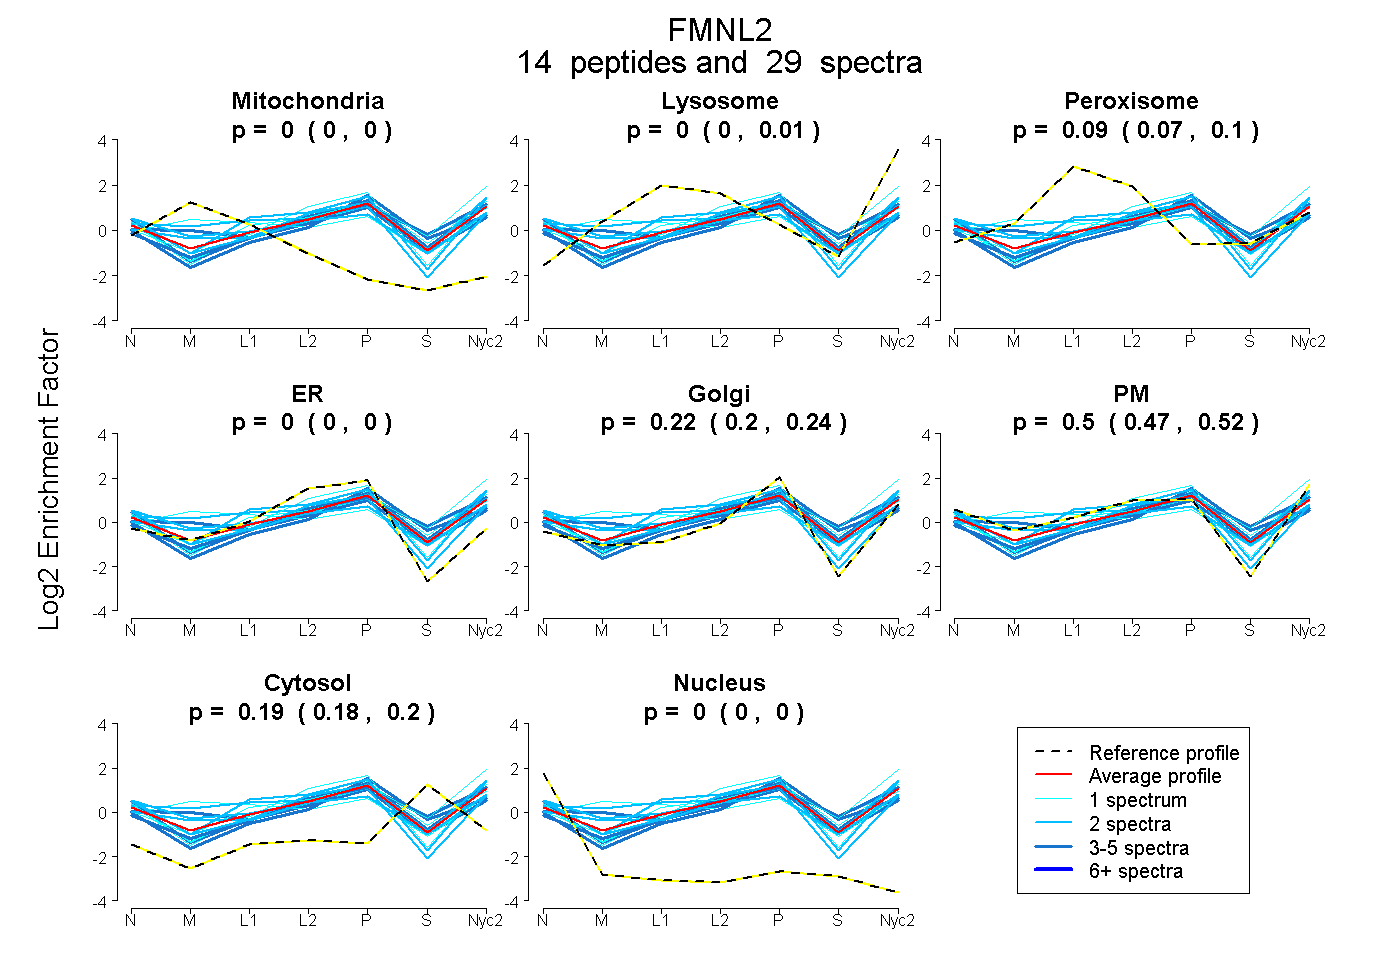 |
0.000
0.000 | 0.000 |
0.003
0.000 | 0.013 |
|
0.089
0.075 | 0.101 |
0.000
0.000 | 0.000 |
0.220
0.201 | 0.237 |
0.499
0.475 | 0.516 |
0.188
0.178 | 0.196 |
0.000
0.000 | 0.000 |
|
| | | Plot |
Mito |
|
Lyso or Perox |
|
ER |
Golgi |
PM |
Cytosol |
Nucleus |
|
| Expt B |
1
peptide |
1
spectrum |
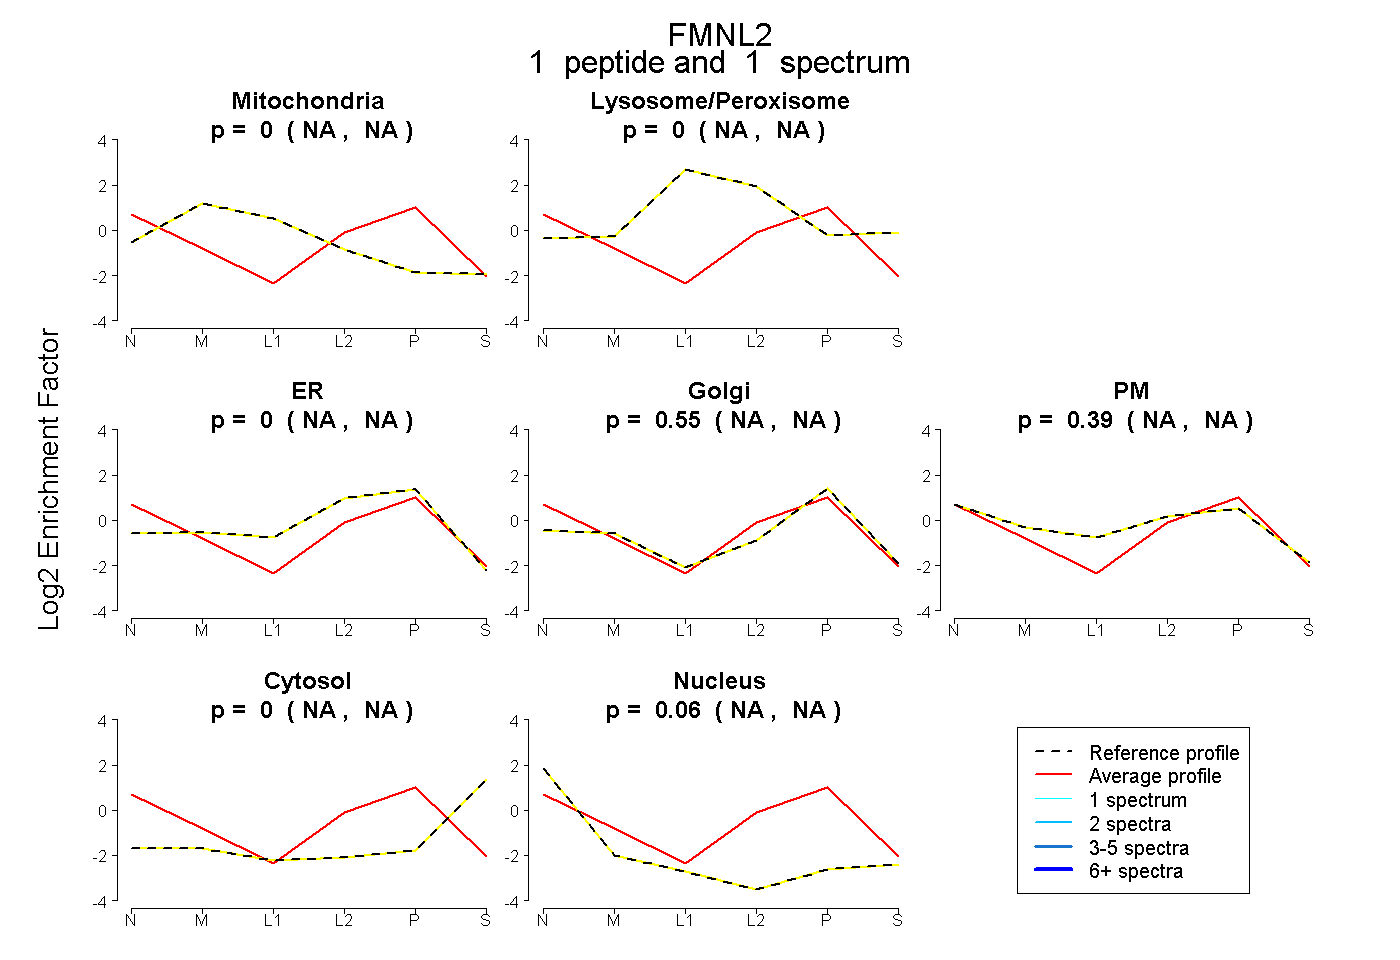 |
0.000
NA | NA |
|
0.000
NA | NA |
|
0.000
NA | NA |
0.551
NA | NA |
0.390
NA | NA |
0.000
NA | NA |
0.060
NA | NA |
|
| | | Plot |
|
Lyso |
|
|
|
|
|
|
|
Other |
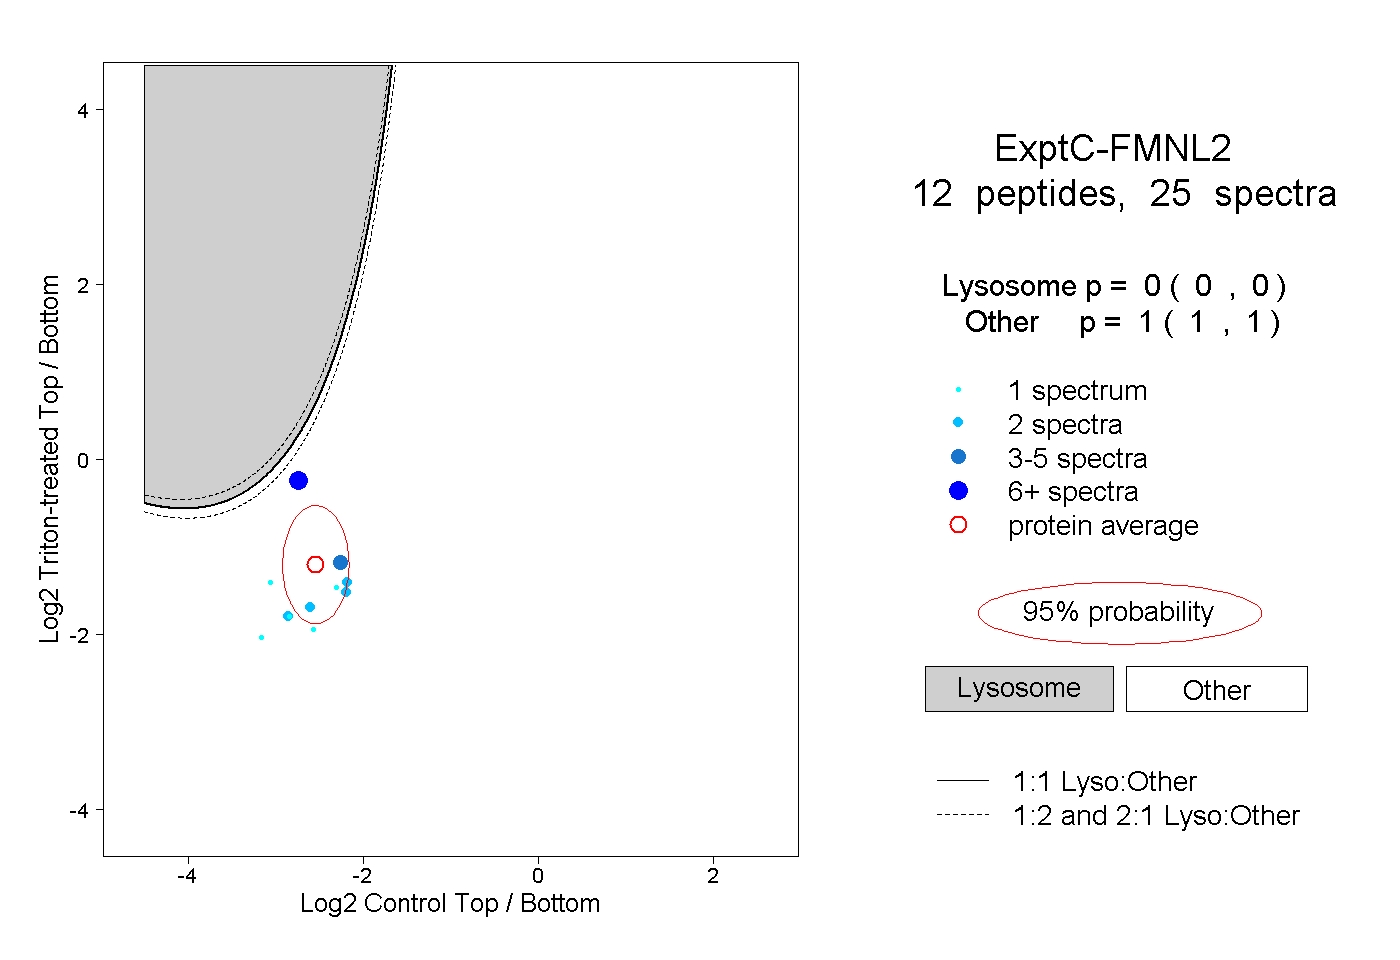
| Expt C |
12
peptides |
25
spectra |
 |
|
0.000
0.000 | 0.000 |
|
|
|
|
|
|
|
1.000
1.000 | 1.000 |
| 2 spectra, FLPTENEVK |
|
0.000 |
|
|
|
|
|
|
|
1.000 |
| 2 spectra, AIHVFDLK |
|
0.000 |
|
|
|
|
|
|
|
1.000 |
| 2 spectra, LVEIEK |
|
0.000 |
|
|
|
|
|
|
|
1.000 |
| 1 spectrum, LQDDAK |
|
0.000 |
|
|
|
|
|
|
|
1.000 |
| 1 spectrum, HVYEGK |
|
0.000 |
|
|
|
|
|
|
|
1.000 |
| 1 spectrum, YNTLPSR |
|
0.000 |
|
|
|
|
|
|
|
1.000 |
| 6 spectra, FDDQNLR |
|
0.012 |
|
|
|
|
|
|
|
0.988 |
| 2 spectra, GAVYGFK |
|
0.000 |
|
|
|
|
|
|
|
1.000 |
| 1 spectrum, VHLQYEFTK |
|
0.000 |
|
|
|
|
|
|
|
1.000 |
| 4 spectra, QYDNEK |
|
0.000 |
|
|
|
|
|
|
|
1.000 |
| 1 spectrum, ESTLEK |
|
0.000 |
|
|
|
|
|
|
|
1.000 |
| 2 spectra, EVCGEK |
|
0.000 |
|
|
|
|
|
|
|
1.000 |