 15
15peptides
spectra
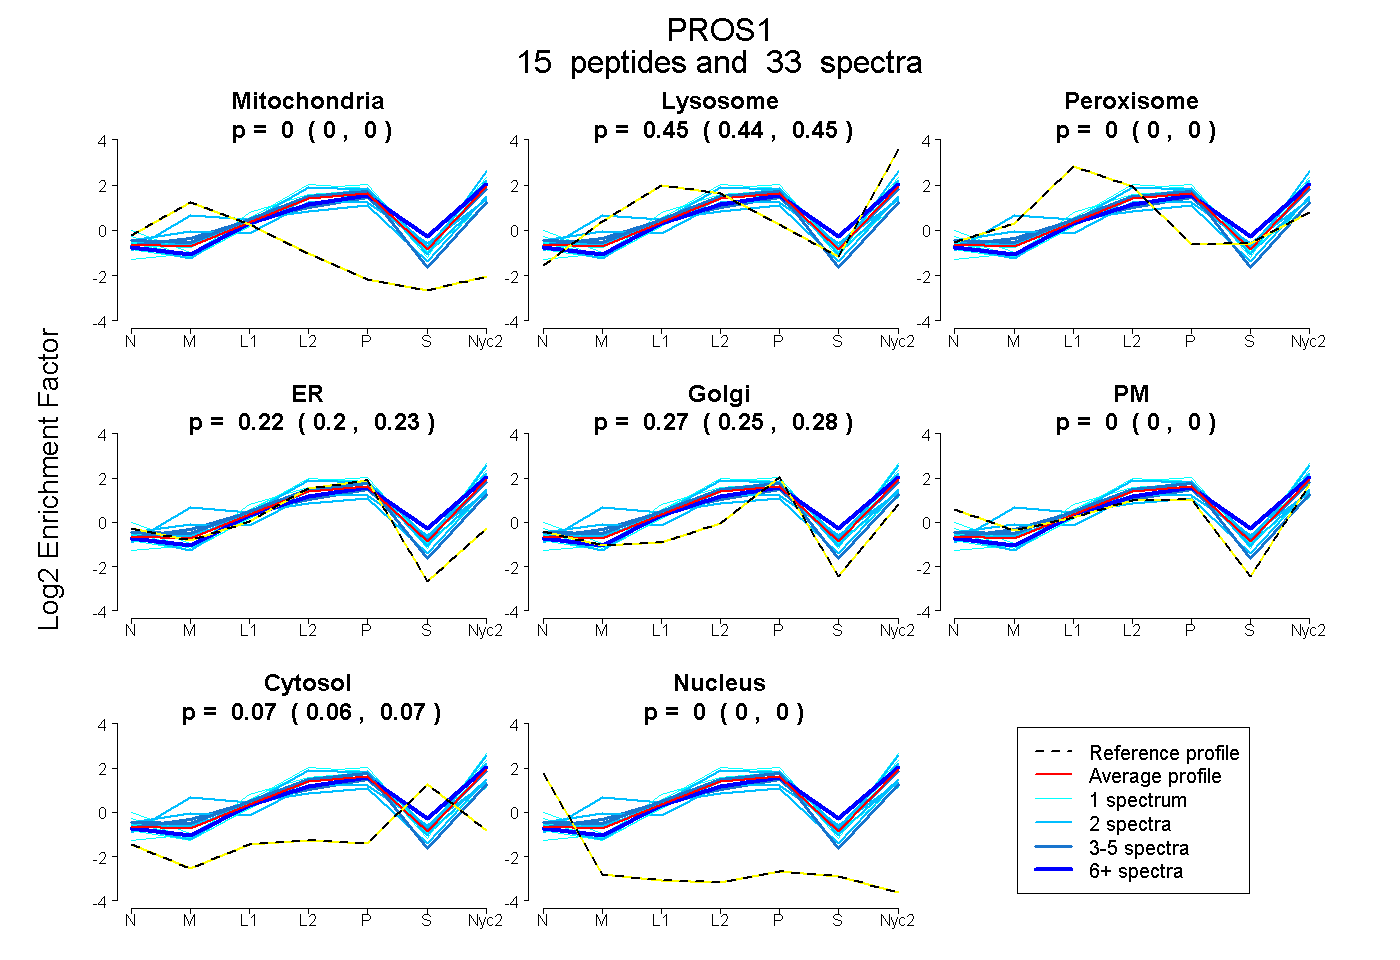
0.000 | 0.000
0.439 | 0.452
0.000 | 0.000
0.198 | 0.230
0.254 | 0.284
0.000 | 0.000
0.062 | 0.074
0.000 | 0.000
5peptides
spectra
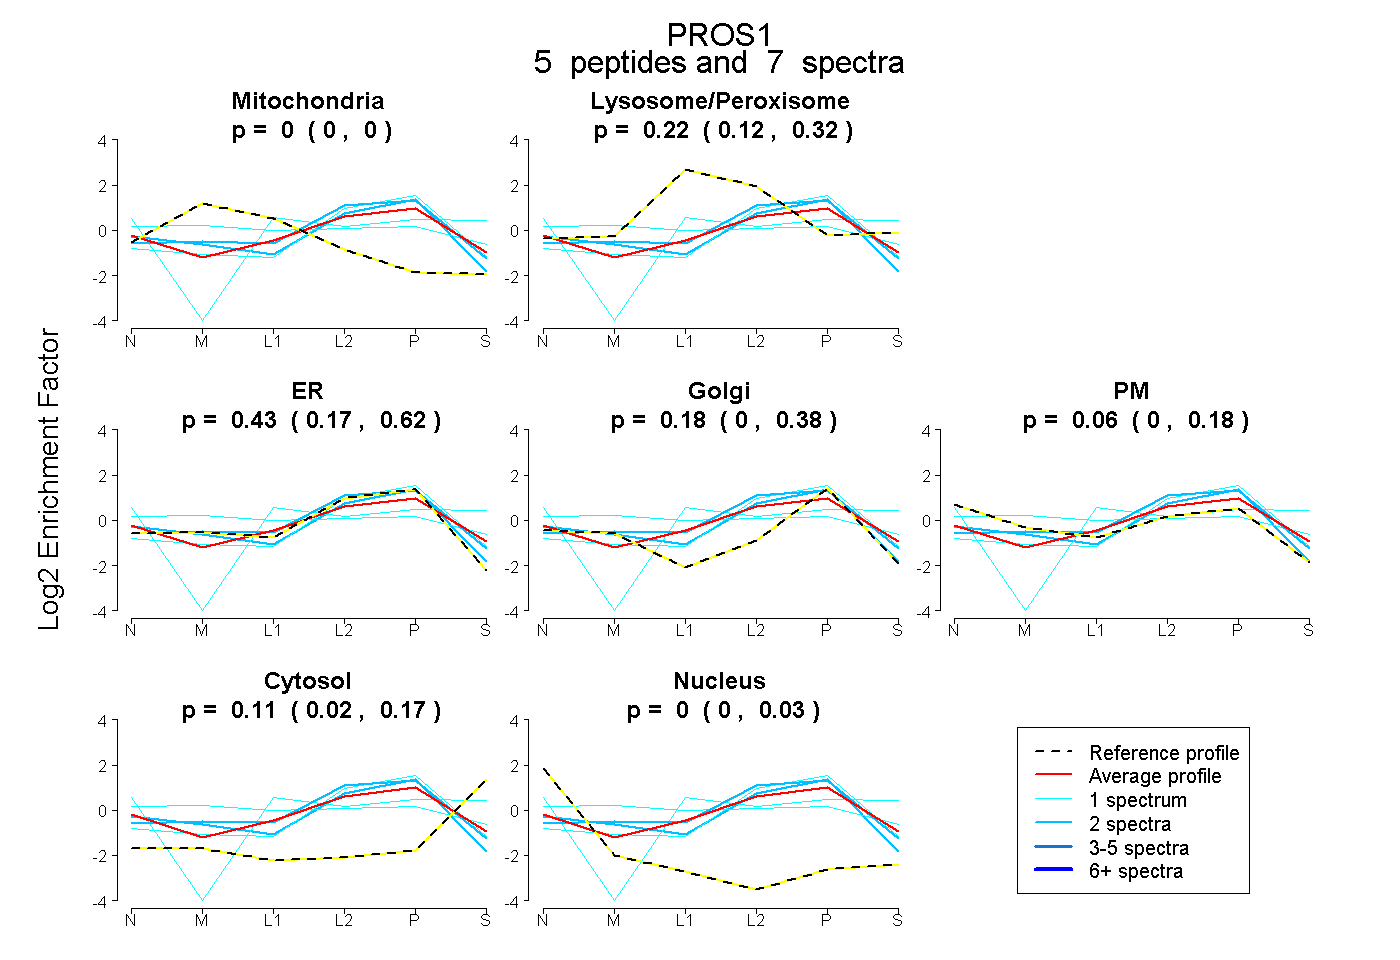
0.000 | 0.000
0.125 | 0.320
0.169 | 0.623
0.000 | 0.380
0.000 | 0.184
0.021 | 0.173
0.000 | 0.033
21peptides
spectra
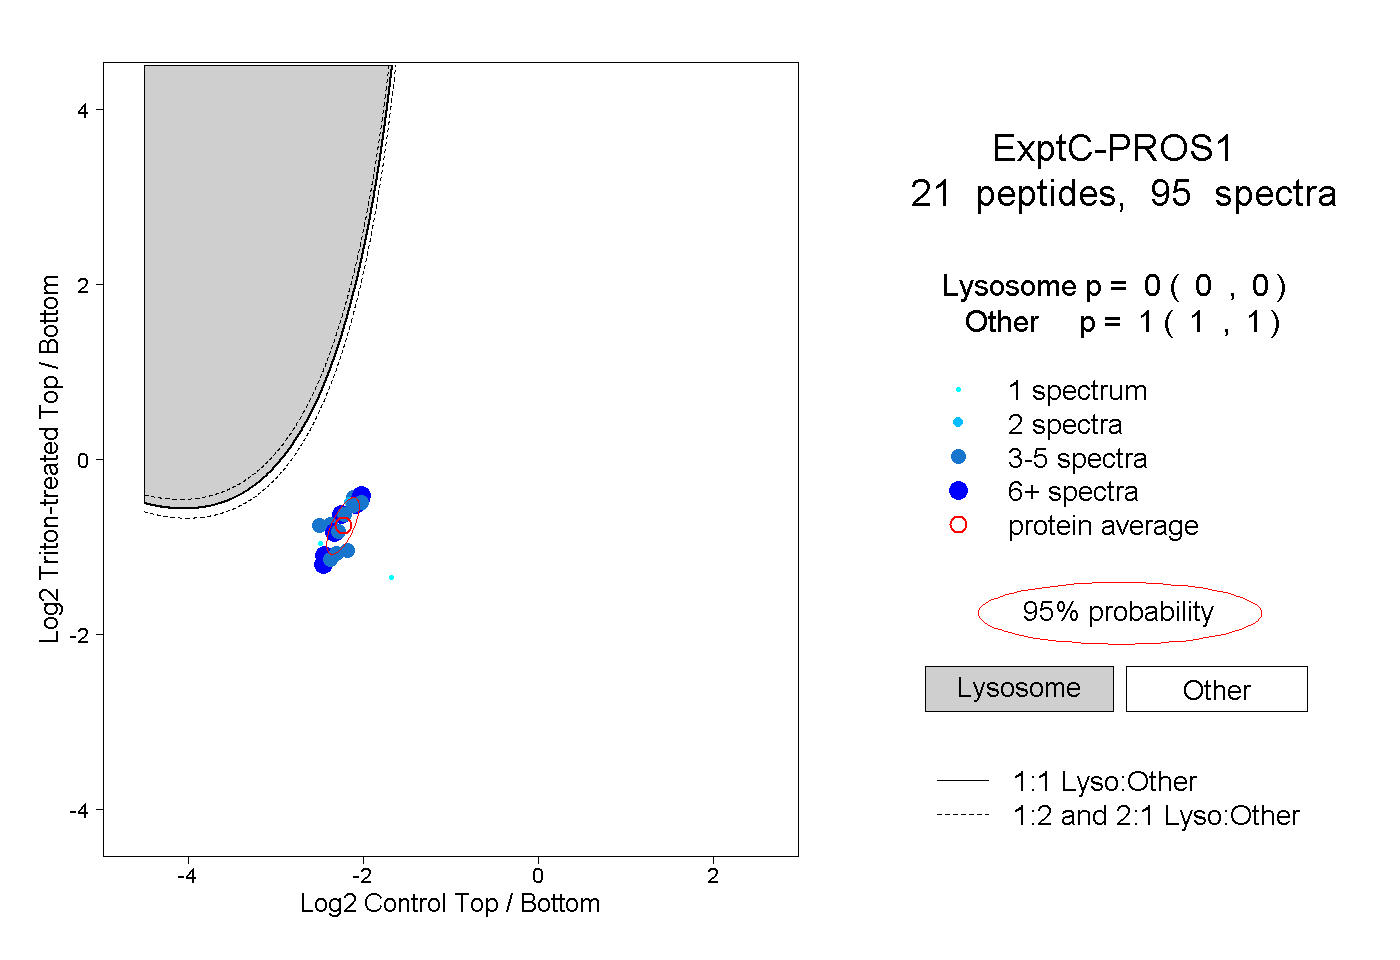
0.000 | 0.000
1.000 | 1.000
4peptides
spectra
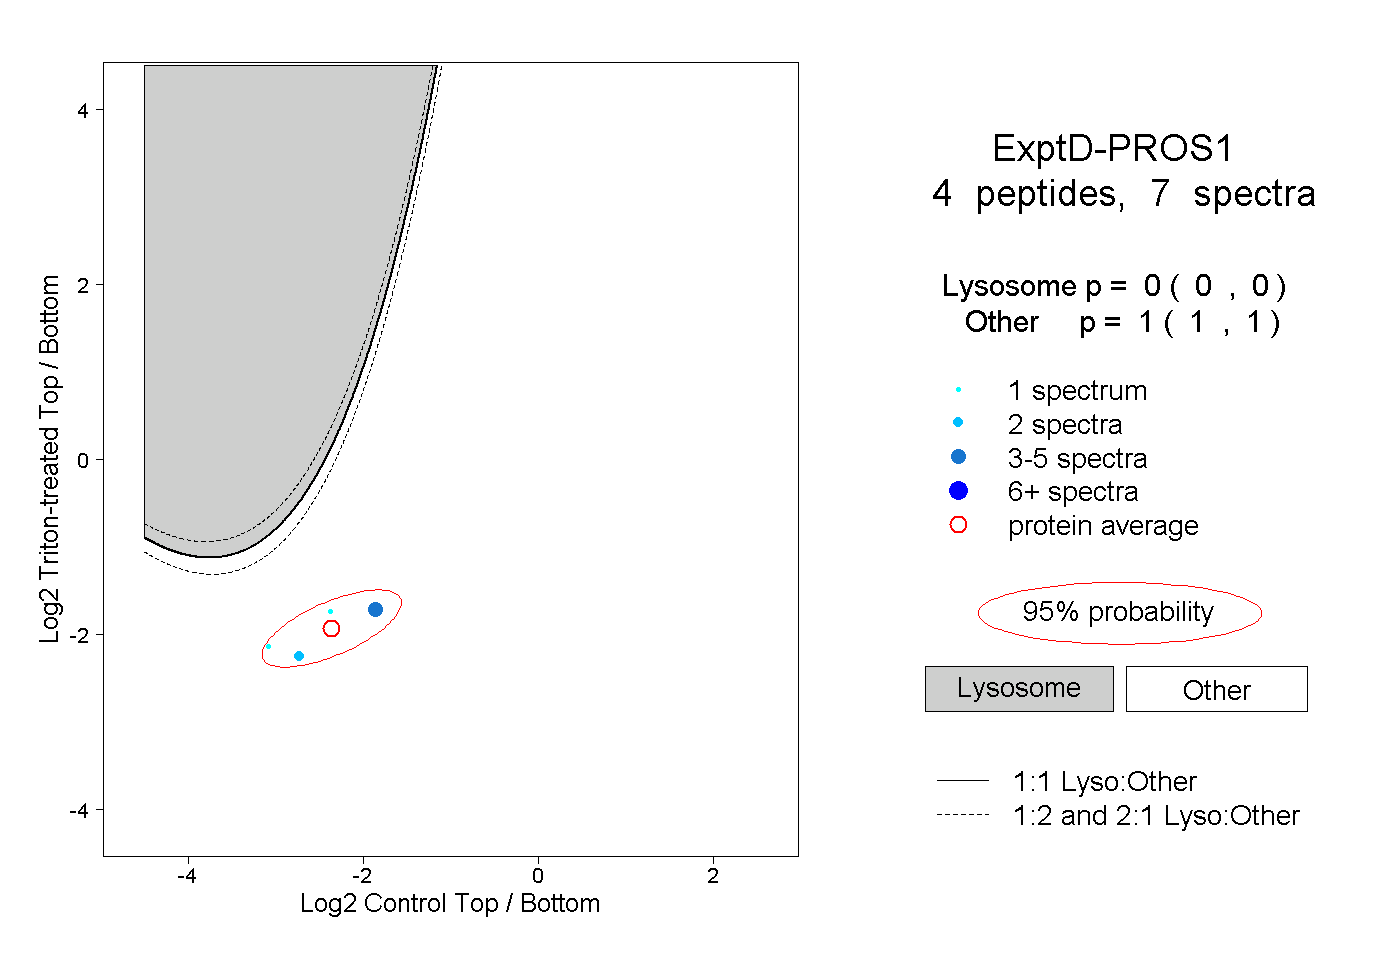
0.000 | 0.000
1.000 | 1.000