 15
15peptides
spectra
0.000 | 0.000
0.439 | 0.452
0.000 | 0.000
0.198 | 0.230
0.254 | 0.284
0.000 | 0.000
0.062 | 0.074
0.000 | 0.000
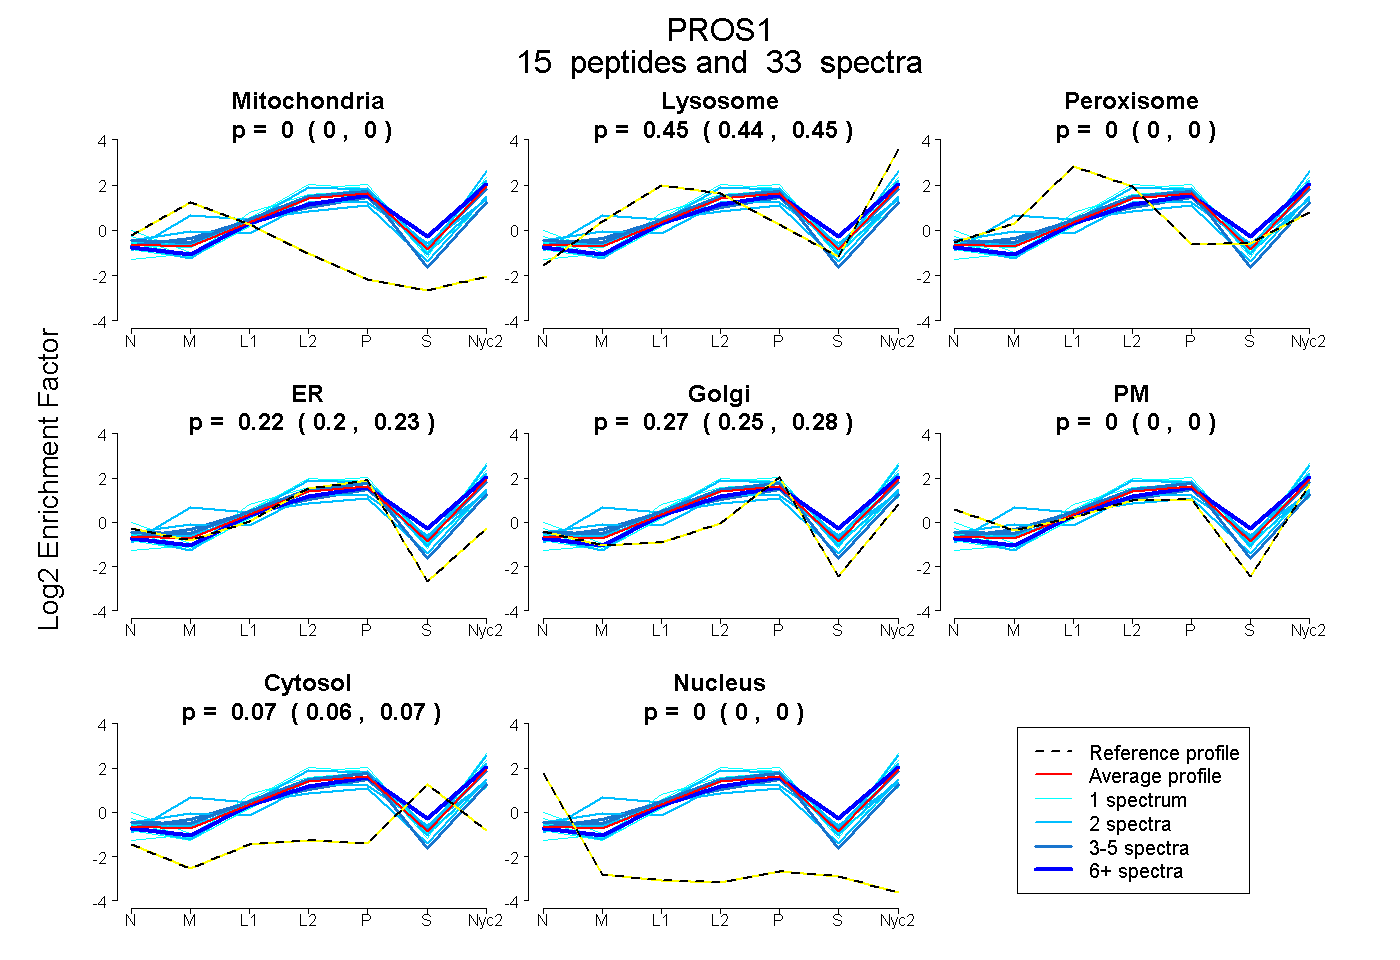
| Plot | Mito | Lyso | Perox | ER | Golgi | PM | Cytosol | Nucleus | |||||
| Expt A |
15 peptides |
33 spectra |
|
0.000 0.000 | 0.000 |
0.446 0.439 | 0.452 |
0.000 0.000 | 0.000 |
0.216 0.198 | 0.230 |
0.270 0.254 | 0.284 |
0.000 0.000 | 0.000 |
0.068 0.062 | 0.074 |
0.000 0.000 | 0.000 |
| 1 spectrum, LPDITR | 0.000 | 0.564 | 0.000 | 0.122 | 0.314 | 0.000 | 0.000 | 0.000 | ||
| 1 spectrum, QSANAYPDLR | 0.000 | 0.433 | 0.000 | 0.199 | 0.231 | 0.000 | 0.136 | 0.000 | ||
| 4 spectra, IYFAGLPR | 0.000 | 0.427 | 0.047 | 0.085 | 0.366 | 0.000 | 0.075 | 0.000 | ||
| 1 spectrum, EIVEGK | 0.000 | 0.435 | 0.000 | 0.187 | 0.320 | 0.006 | 0.052 | 0.000 | ||
| 2 spectra, NGLELWTPVR | 0.000 | 0.526 | 0.000 | 0.162 | 0.272 | 0.040 | 0.000 | 0.000 | ||
| 1 spectrum, HCFLTVEK | 0.000 | 0.302 | 0.027 | 0.555 | 0.000 | 0.018 | 0.097 | 0.000 | ||
| 1 spectrum, QLAILDK | 0.000 | 0.442 | 0.000 | 0.132 | 0.269 | 0.014 | 0.142 | 0.000 | ||
| 1 spectrum, FSAEFDFR | 0.000 | 0.318 | 0.000 | 0.000 | 0.128 | 0.459 | 0.095 | 0.000 | ||
| 2 spectra, VGAFSAAR | 0.000 | 0.460 | 0.000 | 0.126 | 0.343 | 0.000 | 0.070 | 0.000 | ||
| 2 spectra, DVIYSK | 0.115 | 0.459 | 0.016 | 0.100 | 0.311 | 0.000 | 0.000 | 0.000 | ||
| 1 spectrum, LGSLFKPTDGFLDTK | 0.000 | 0.534 | 0.000 | 0.199 | 0.223 | 0.045 | 0.000 | 0.000 | ||
| 7 spectra, YDPSSK | 0.000 | 0.462 | 0.000 | 0.080 | 0.299 | 0.000 | 0.159 | 0.000 | ||
| 2 spectra, EAVMNINK | 0.000 | 0.358 | 0.000 | 0.348 | 0.230 | 0.000 | 0.065 | 0.000 | ||
| 2 spectra, LDGCLR | 0.000 | 0.324 | 0.000 | 0.238 | 0.102 | 0.170 | 0.166 | 0.000 | ||
| 5 spectra, YLGCLGAFR | 0.000 | 0.320 | 0.000 | 0.500 | 0.141 | 0.032 | 0.007 | 0.000 |
| Plot | Mito | Lyso or Perox | ER | Golgi | PM | Cytosol | Nucleus | ||||||
| Expt B |
5 peptides |
7 spectra |
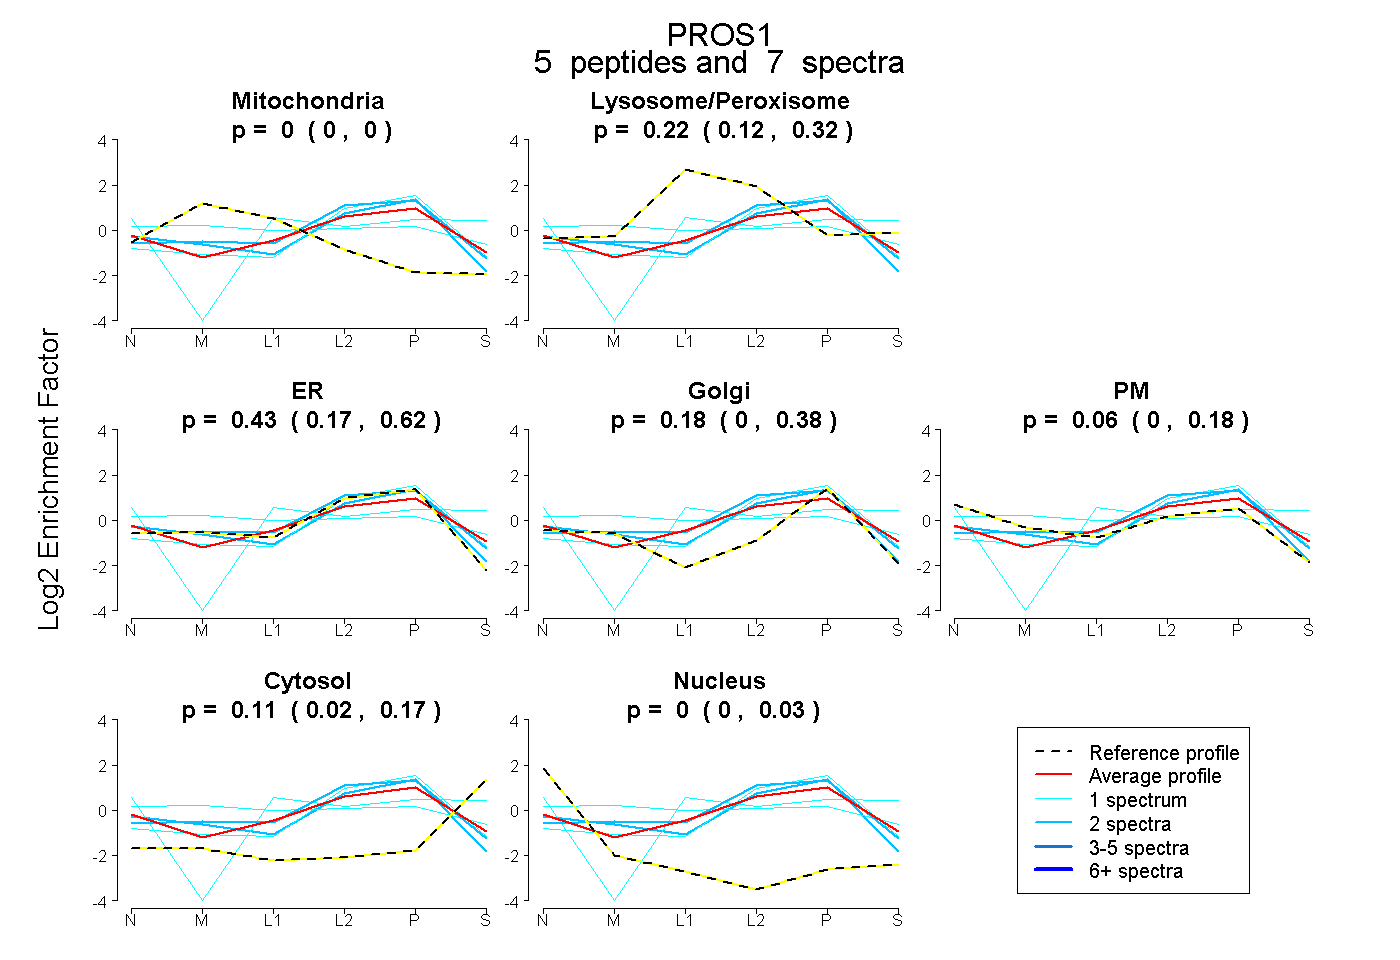 |
0.000 0.000 | 0.000 |
0.221 0.125 | 0.320 |
0.427 0.169 | 0.623 |
0.178 0.000 | 0.380 |
0.064 0.000 | 0.184 |
0.109 0.021 | 0.173 |
0.000 0.000 | 0.033 |
|||
| Plot | Lyso | Other | |||||||||||
| Expt C |
21 peptides |
95 spectra |
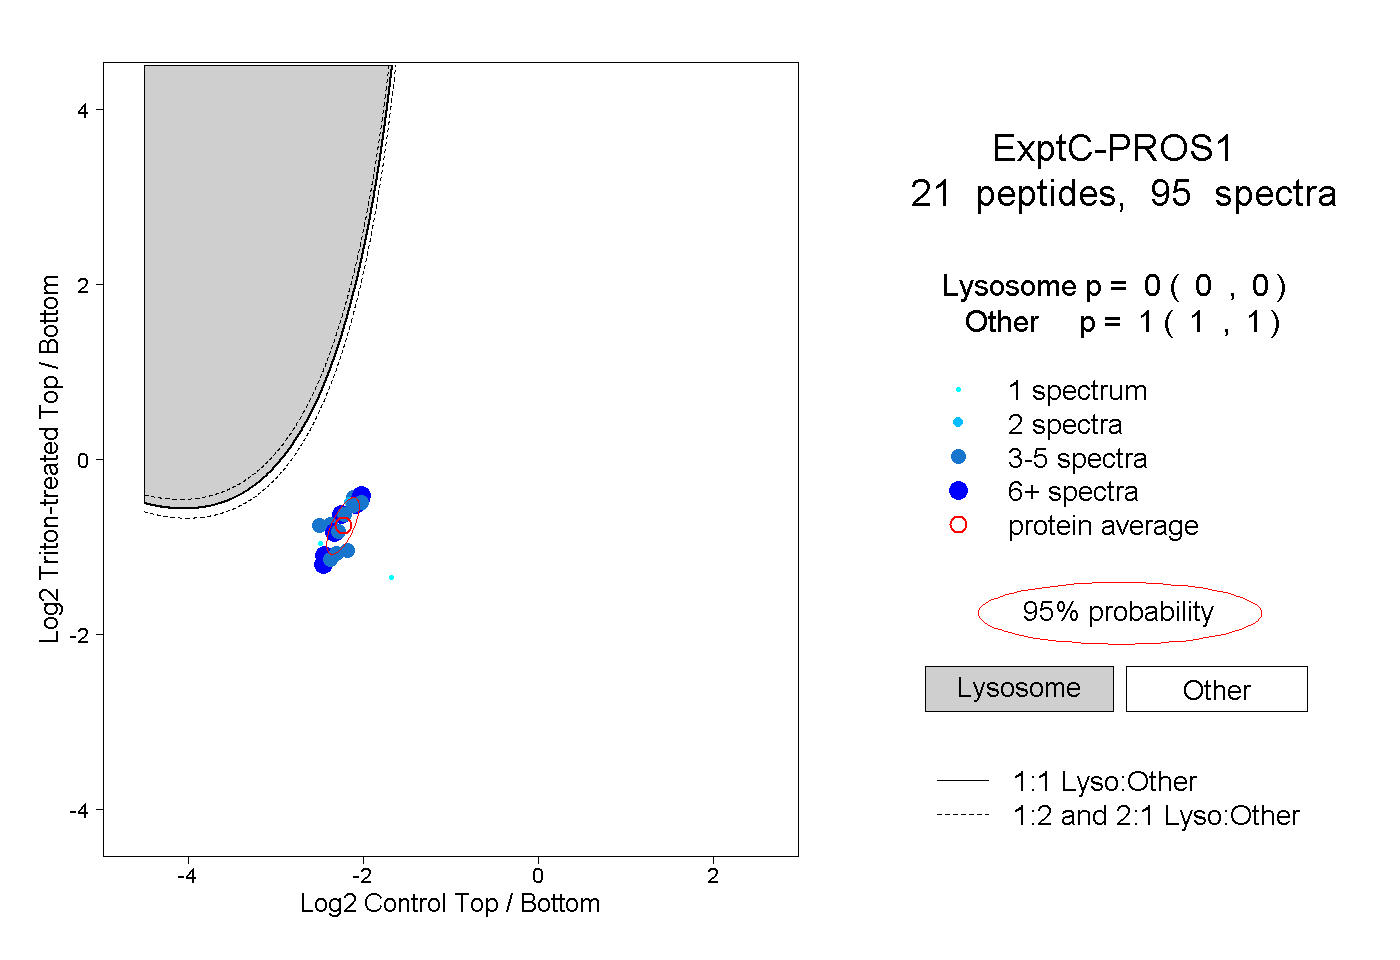 |
0.000 0.000 | 0.000 |
1.000 1.000 | 1.000 |
||||||||
| Plot | Lyso | Other | |||||||||||
| Expt D |
4 peptides |
7 spectra |
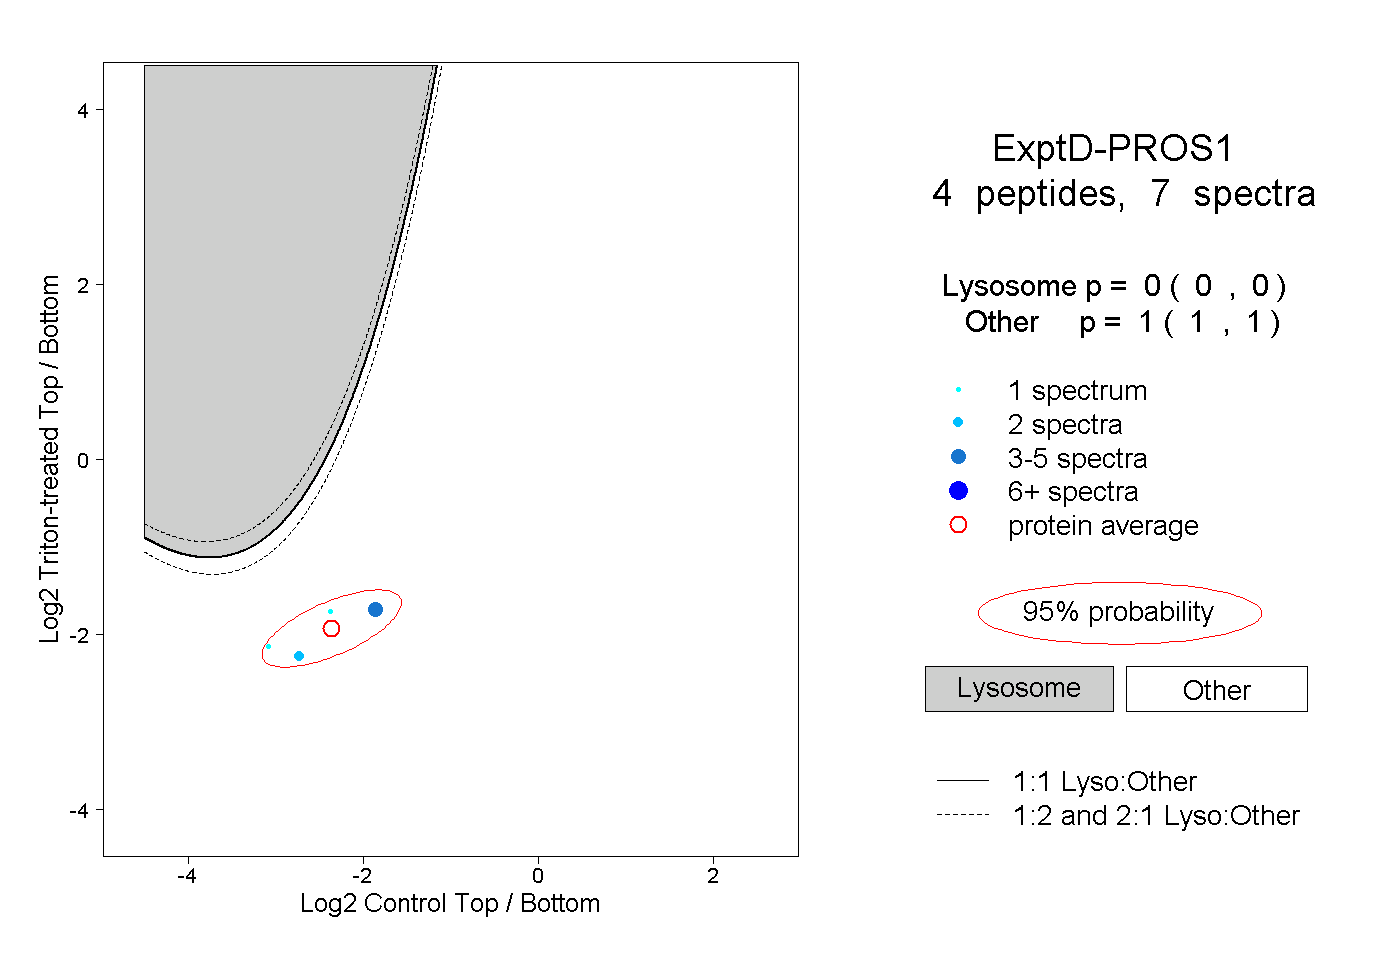 |
0.000 0.000 | 0.000 |
1.000 1.000 | 1.000 |