PROS1
[ENSRNOP00000064737]
Main page
| | | Plot |
Mito |
Lyso |
|
Perox |
ER |
Golgi |
PM |
Cytosol |
Nucleus |
|
| Expt A |
 15
15
peptides |
33
spectra |
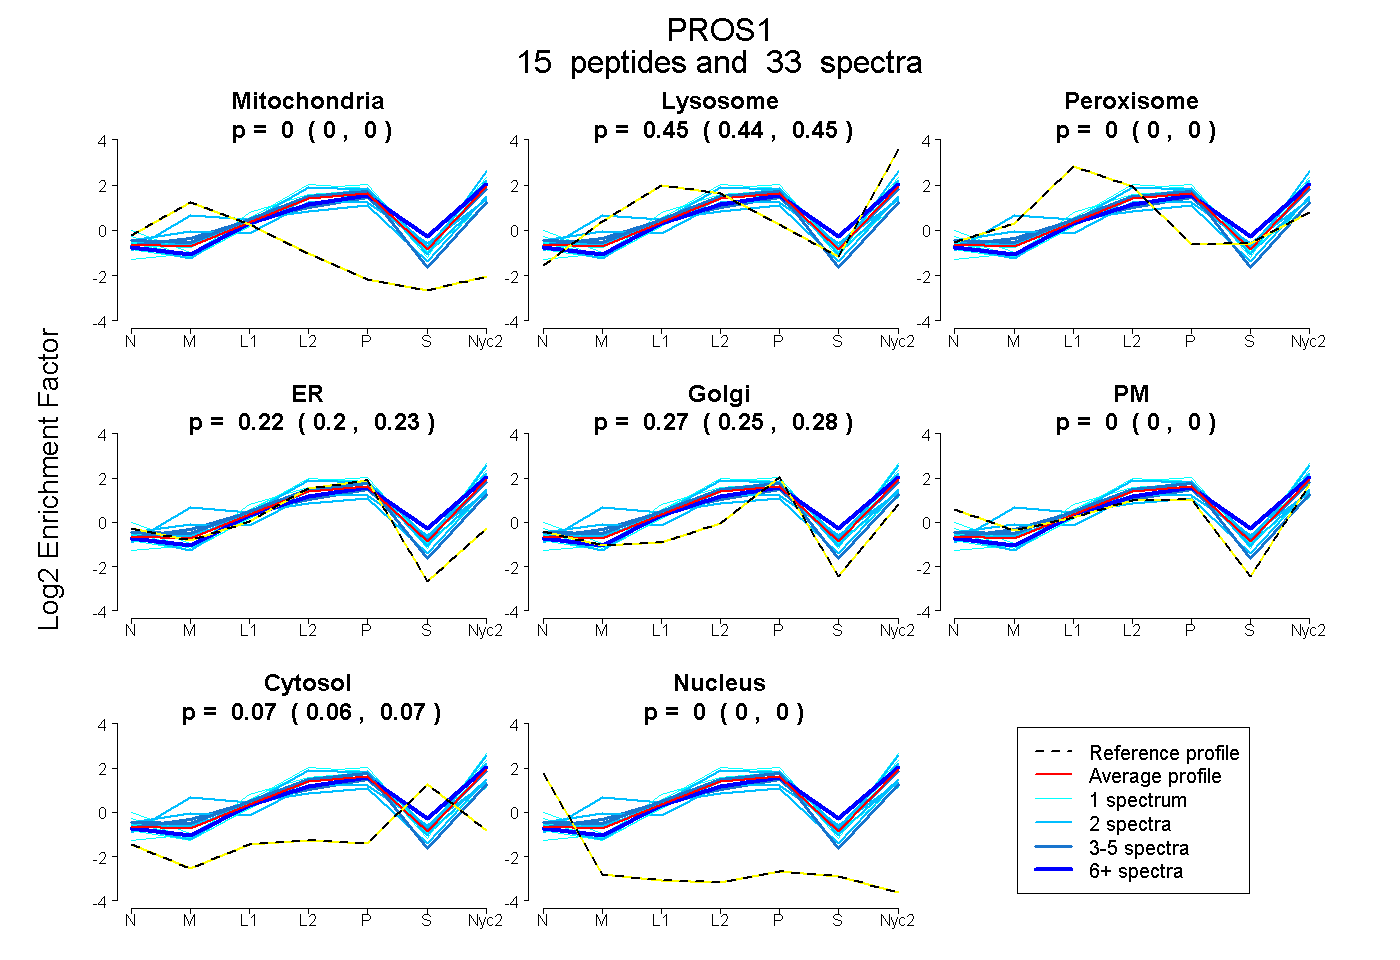 |
0.000
0.000 | 0.000 |
0.446
0.439 | 0.452 |
|
0.000
0.000 | 0.000 |
0.216
0.198 | 0.230 |
0.270
0.254 | 0.284 |
0.000
0.000 | 0.000 |
0.068
0.062 | 0.074 |
0.000
0.000 | 0.000 |
|
| | | Plot |
Mito |
|
Lyso or Perox |
|
ER |
Golgi |
PM |
Cytosol |
Nucleus |
|
| Expt B |
5
peptides |
7
spectra |
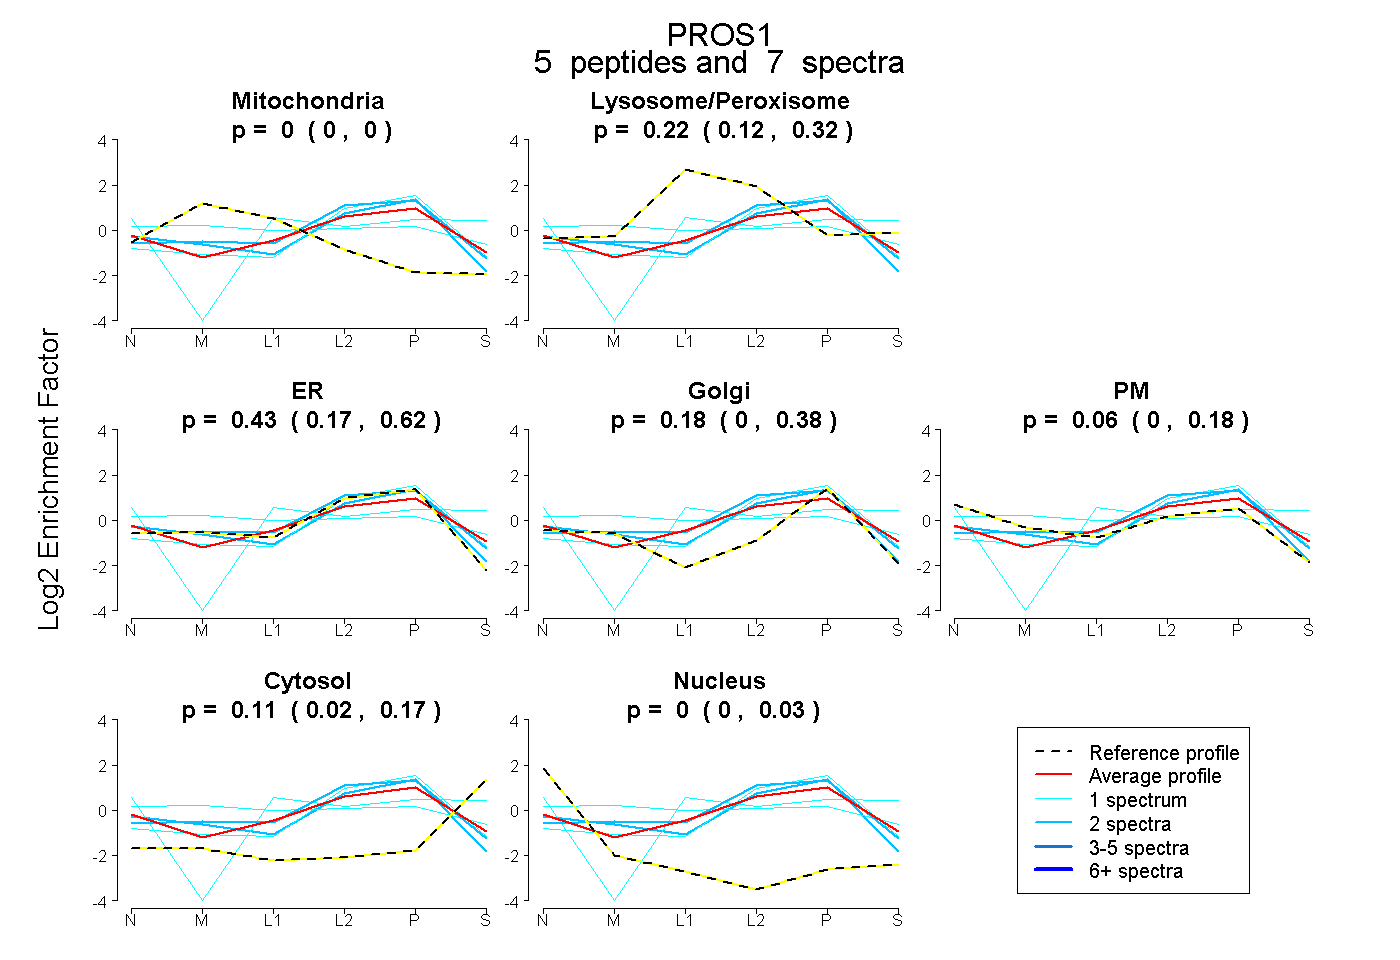 |
0.000
0.000 | 0.000 |
|
0.221
0.125 | 0.320 |
|
0.427
0.169 | 0.623 |
0.178
0.000 | 0.380 |
0.064
0.000 | 0.184 |
0.109
0.021 | 0.173 |
0.000
0.000 | 0.033 |
|
| 1 spectrum, QLAILDK |
0.000 |
|
0.495 |
|
0.096 |
0.000 |
0.000 |
0.256 |
0.153 |
|
| 1 spectrum, VGAFSAAR |
0.000 |
|
0.000 |
|
0.872 |
0.000 |
0.000 |
0.128 |
0.000 |
|
| 1 spectrum, QGALGAK |
0.103 |
|
0.270 |
|
0.000 |
0.072 |
0.449 |
0.106 |
0.000 |
|
| 2 spectra, ASQVLVR |
0.000 |
|
0.000 |
|
0.736 |
0.109 |
0.137 |
0.018 |
0.000 |
|
| 2 spectra, YLGCLGAFR |
0.000 |
|
0.140 |
|
0.775 |
0.028 |
0.000 |
0.057 |
0.000 |
|
| | | Plot |
|
Lyso |
|
|
|
|
|
|
|
Other |
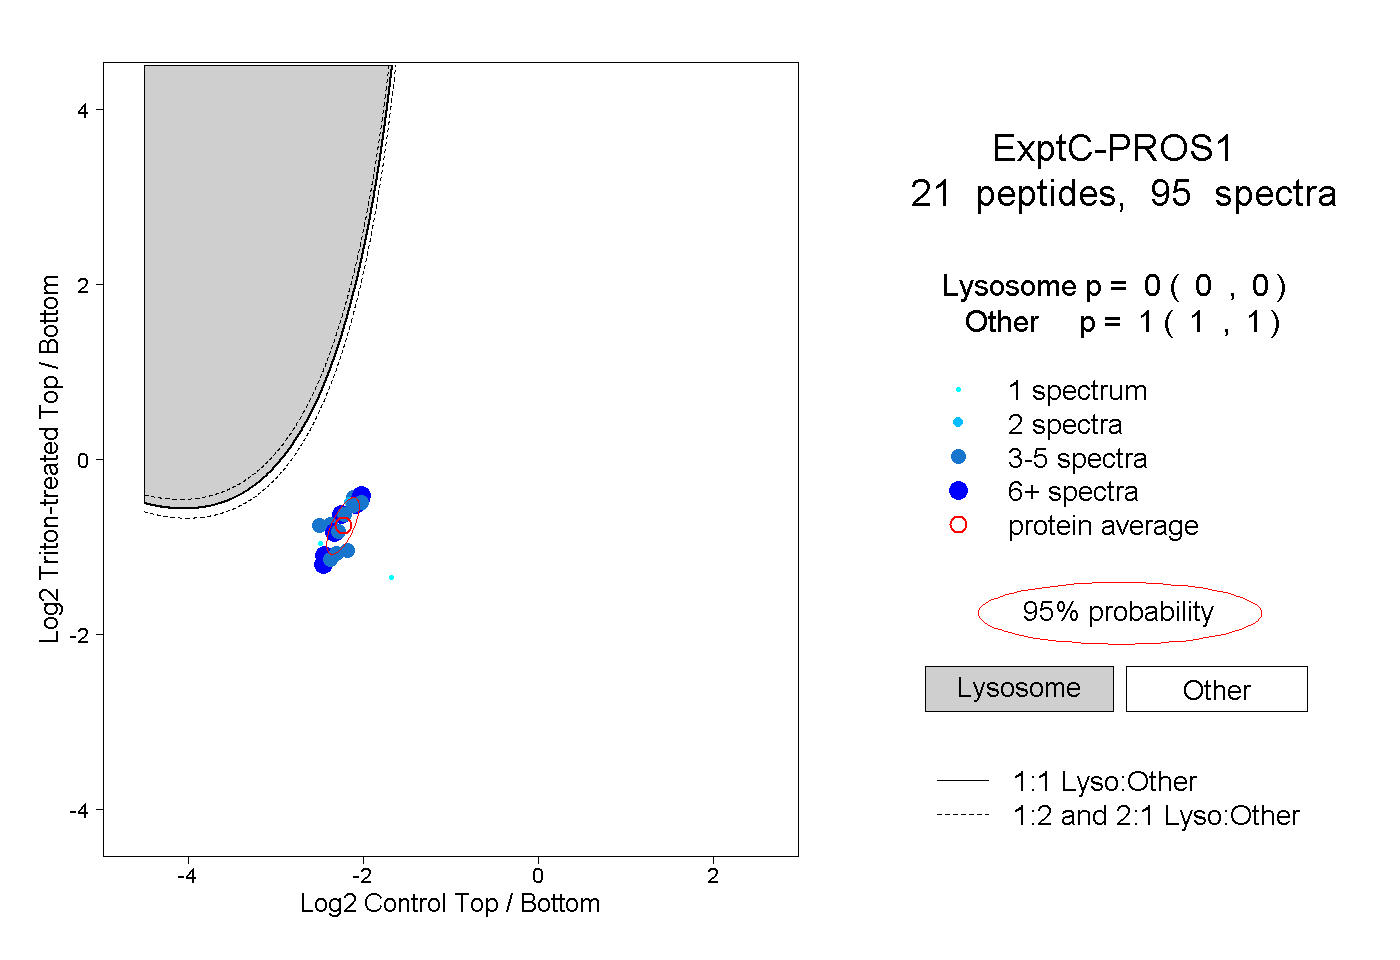
| Expt C |
21
peptides |
95
spectra |
 |
|
0.000
0.000 | 0.000 |
|
|
|
|
|
|
|
1.000
1.000 | 1.000 |
| | | Plot |
|
Lyso |
|
|
|
|
|
|
|
Other |
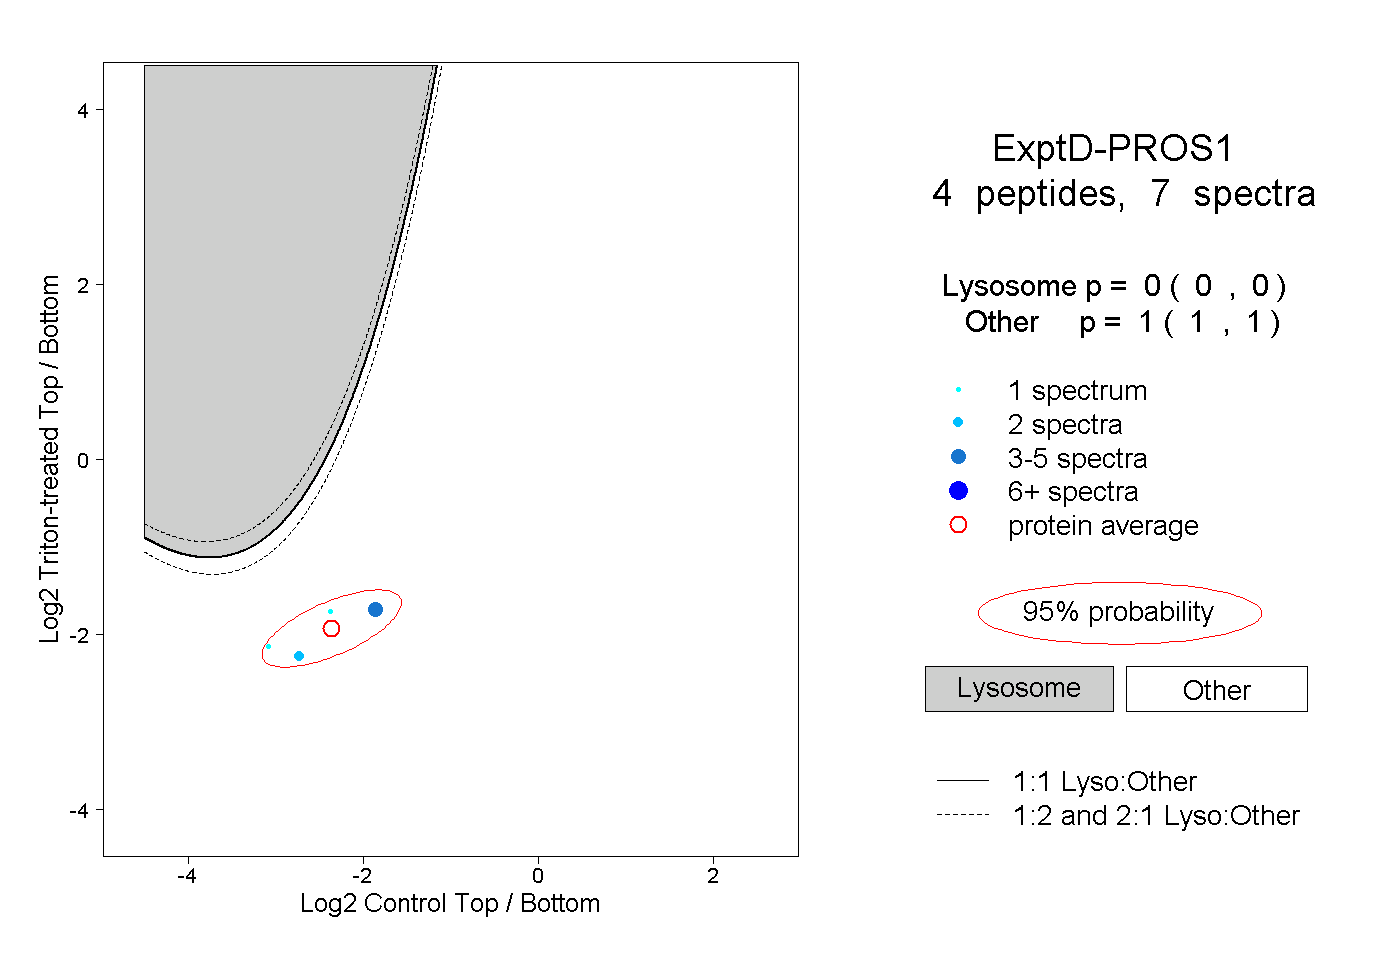
| Expt D |
4
peptides |
7
spectra |
 |
|
0.000
0.000 | 0.000 |
|
|
|
|
|
|
|
1.000
1.000 | 1.000 |