 9
9peptides
spectra
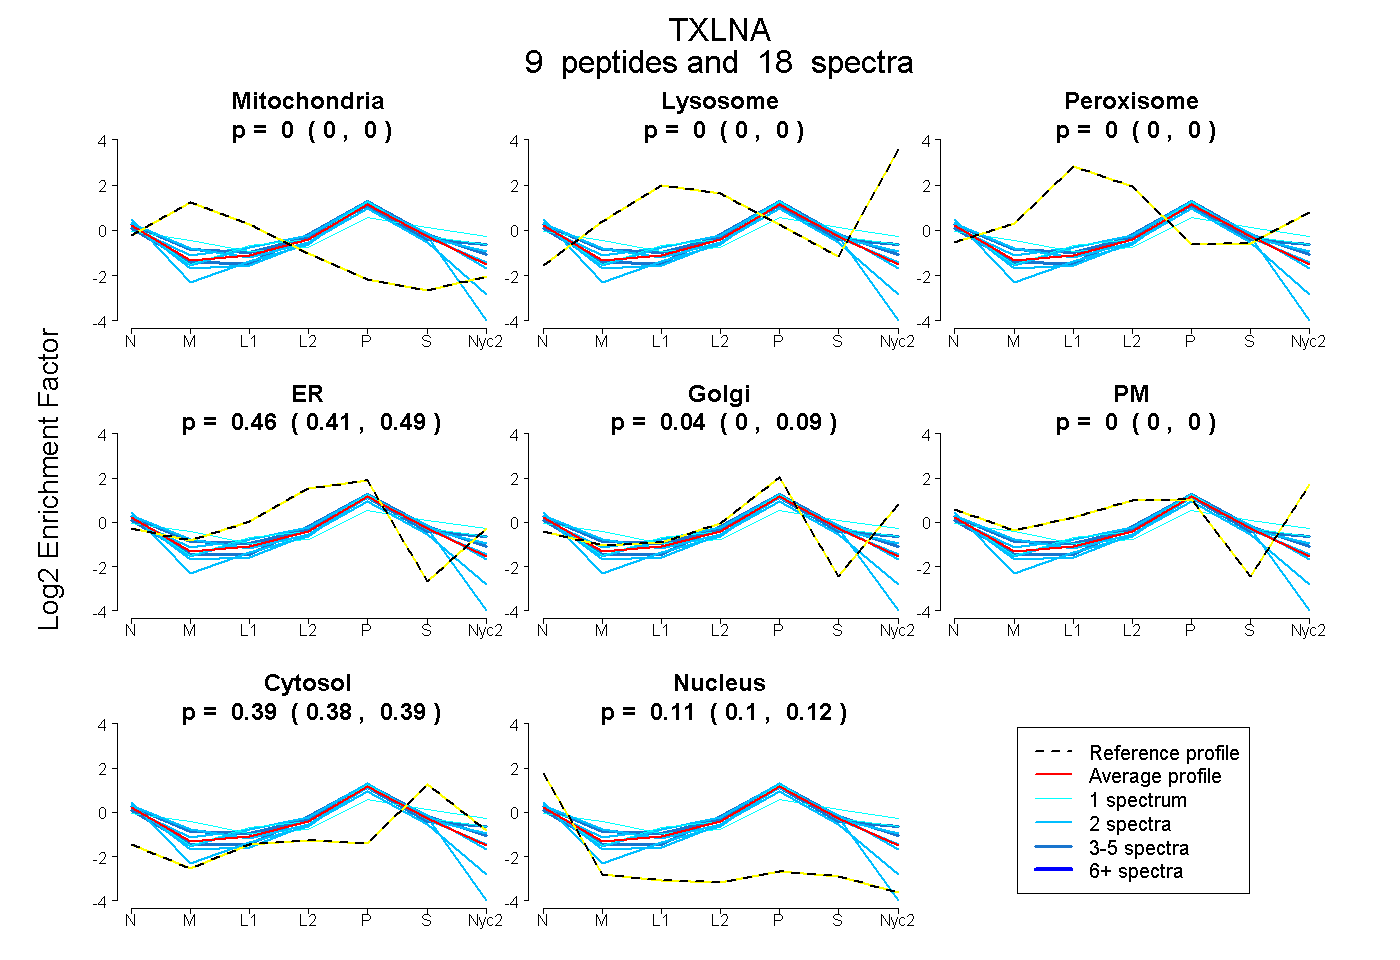
0.000 | 0.000
0.000 | 0.000
0.000 | 0.000
0.413 | 0.493
0.000 | 0.090
0.000 | 0.000
0.380 | 0.392
0.098 | 0.124
3peptides
spectra
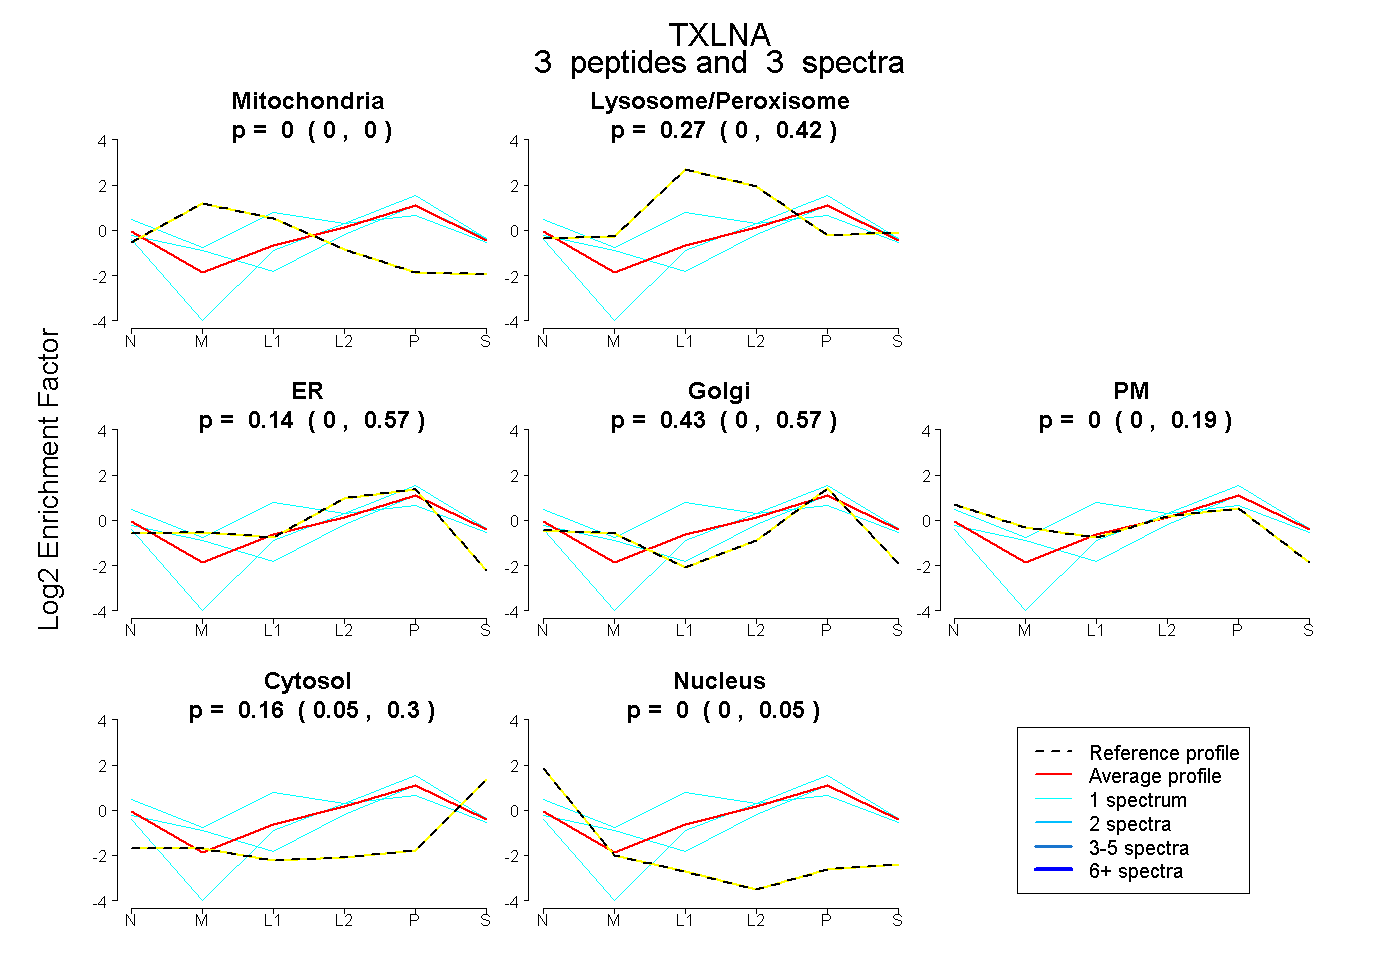
0.000 | 0.000
0.000 | 0.422
0.000 | 0.569
0.000 | 0.570
0.000 | 0.187
0.049 | 0.298
0.000 | 0.052
4peptides
spectra
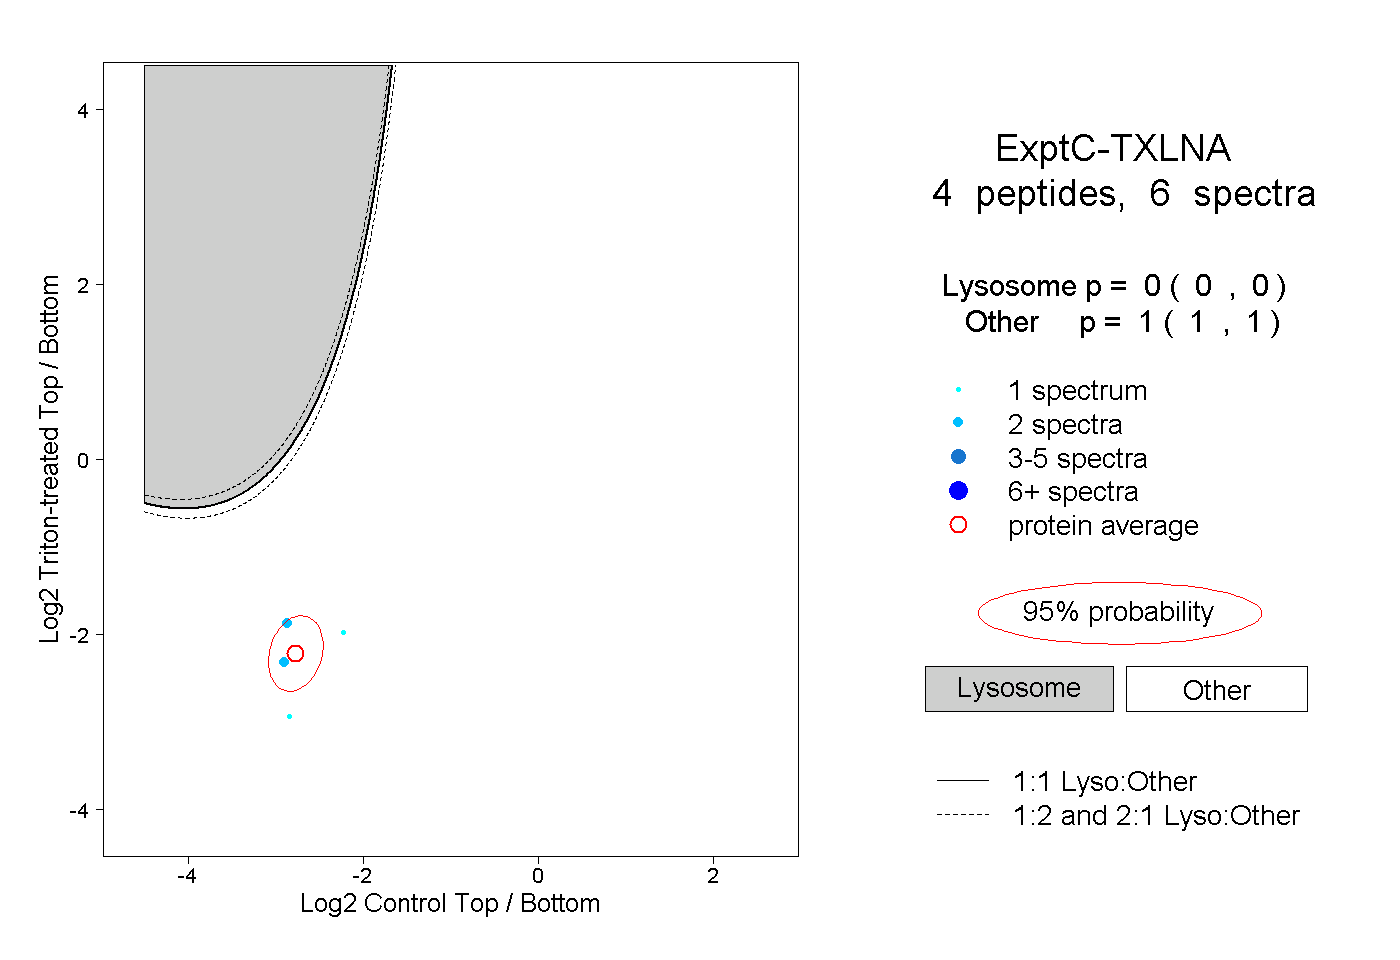
0.000 | 0.000
1.000 | 1.000