 9
9peptides
spectra
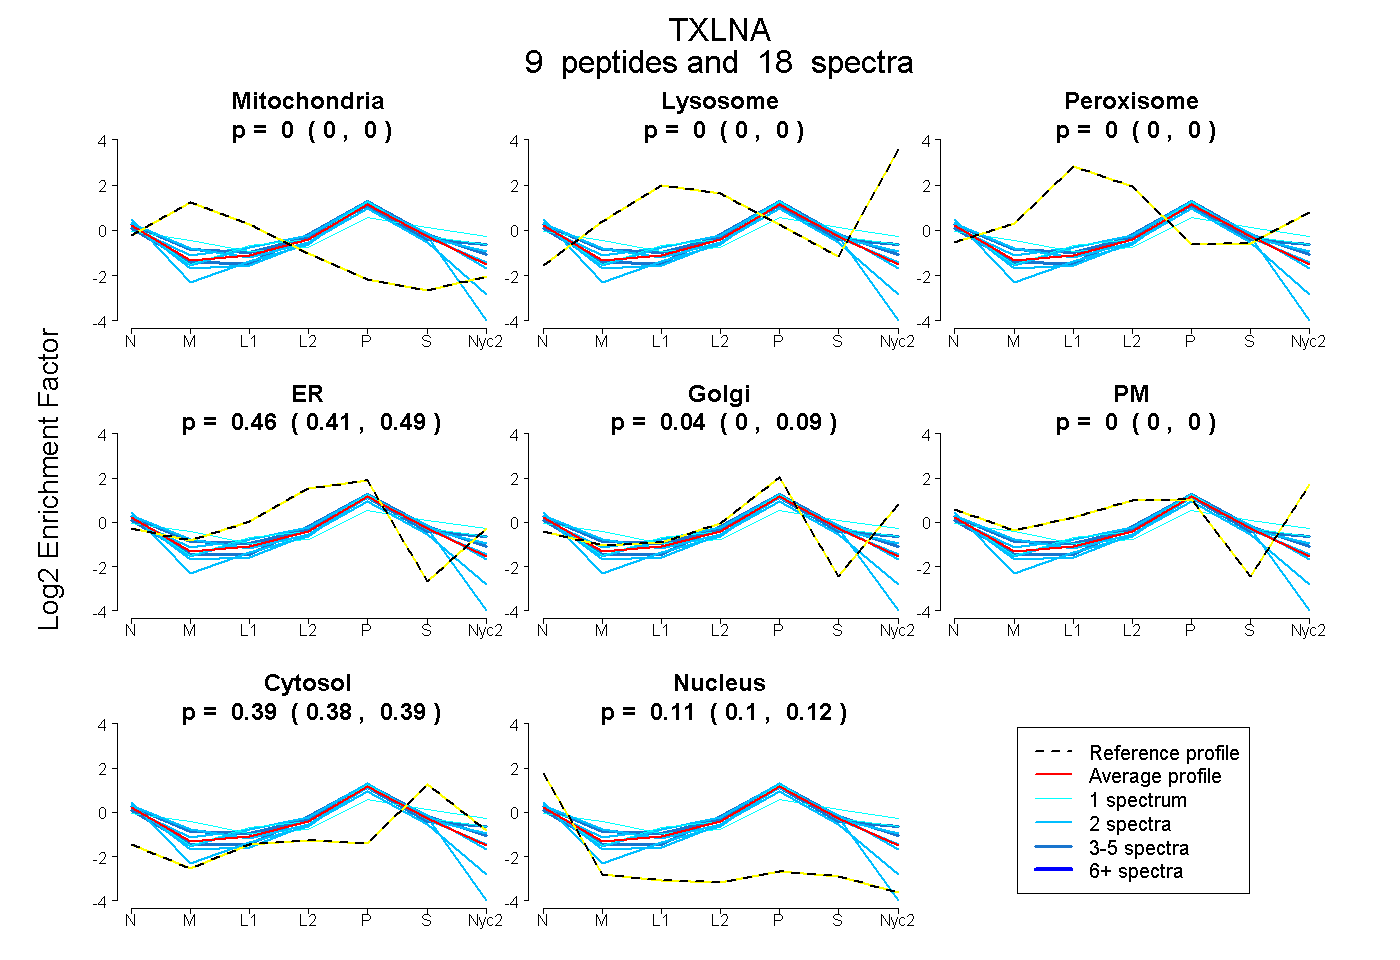
0.000 | 0.000
0.000 | 0.000
0.000 | 0.000
0.413 | 0.493
0.000 | 0.090
0.000 | 0.000
0.380 | 0.392
0.098 | 0.124
| Plot | Mito | Lyso | Perox | ER | Golgi | PM | Cytosol | Nucleus | |||||
| Expt A |
9 peptides |
18 spectra |
|
0.000 0.000 | 0.000 |
0.000 0.000 | 0.000 |
0.000 0.000 | 0.000 |
0.461 0.413 | 0.493 |
0.040 0.000 | 0.090 |
0.000 0.000 | 0.000 |
0.387 0.380 | 0.392 |
0.112 0.098 | 0.124 |
| 2 spectra, ALLEMAEEK | 0.023 | 0.000 | 0.000 | 0.462 | 0.000 | 0.000 | 0.277 | 0.239 | ||
| 1 spectrum, QQETHLK | 0.000 | 0.000 | 0.000 | 0.302 | 0.279 | 0.000 | 0.396 | 0.023 | ||
| 3 spectra, EEHLDK | 0.000 | 0.000 | 0.000 | 0.327 | 0.208 | 0.000 | 0.405 | 0.060 | ||
| 2 spectra, YAELLEEHR | 0.000 | 0.000 | 0.000 | 0.358 | 0.090 | 0.000 | 0.398 | 0.154 | ||
| 1 spectrum, MCELMK | 0.100 | 0.000 | 0.037 | 0.000 | 0.335 | 0.100 | 0.427 | 0.000 | ||
| 3 spectra, ETTVYR | 0.015 | 0.000 | 0.000 | 0.276 | 0.276 | 0.043 | 0.349 | 0.041 | ||
| 2 spectra, GEPGTEEIR | 0.000 | 0.000 | 0.000 | 0.146 | 0.364 | 0.000 | 0.372 | 0.117 | ||
| 2 spectra, IAAICK | 0.000 | 0.000 | 0.000 | 0.528 | 0.000 | 0.000 | 0.385 | 0.087 | ||
| 2 spectra, RPEAATASK | 0.052 | 0.000 | 0.000 | 0.454 | 0.000 | 0.000 | 0.270 | 0.224 |
| Plot | Mito | Lyso or Perox | ER | Golgi | PM | Cytosol | Nucleus | ||||||
| Expt B |
3 peptides |
3 spectra |
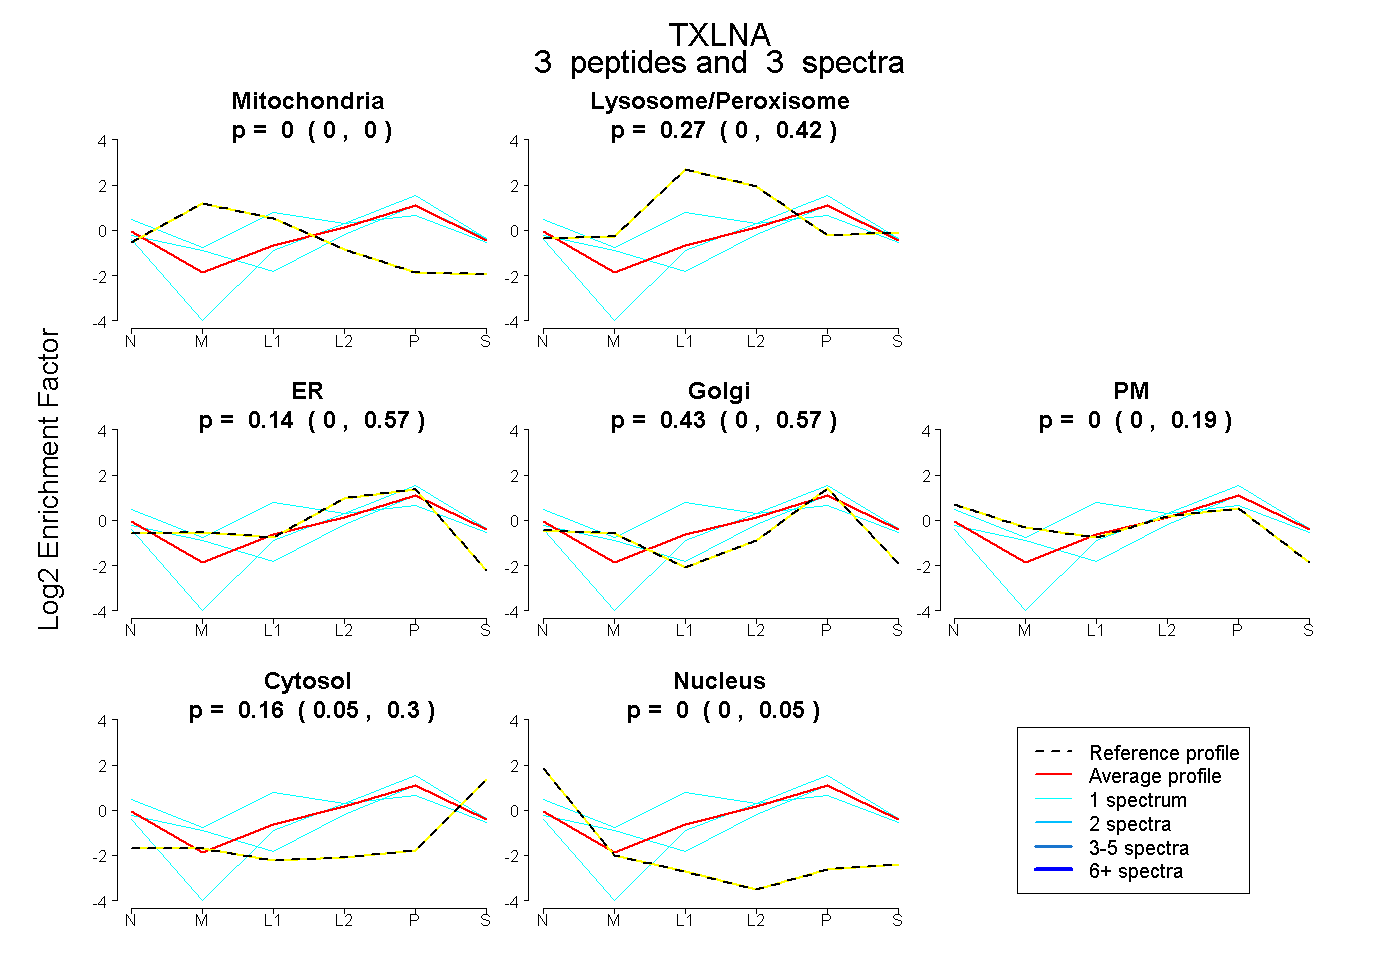 |
0.000 0.000 | 0.000 |
0.273 0.000 | 0.422 |
0.135 0.000 | 0.569 |
0.435 0.000 | 0.570 |
0.000 0.000 | 0.187 |
0.157 0.049 | 0.298 |
0.000 0.000 | 0.052 |
|||
| Plot | Lyso | Other | |||||||||||
| Expt C |
4 peptides |
6 spectra |
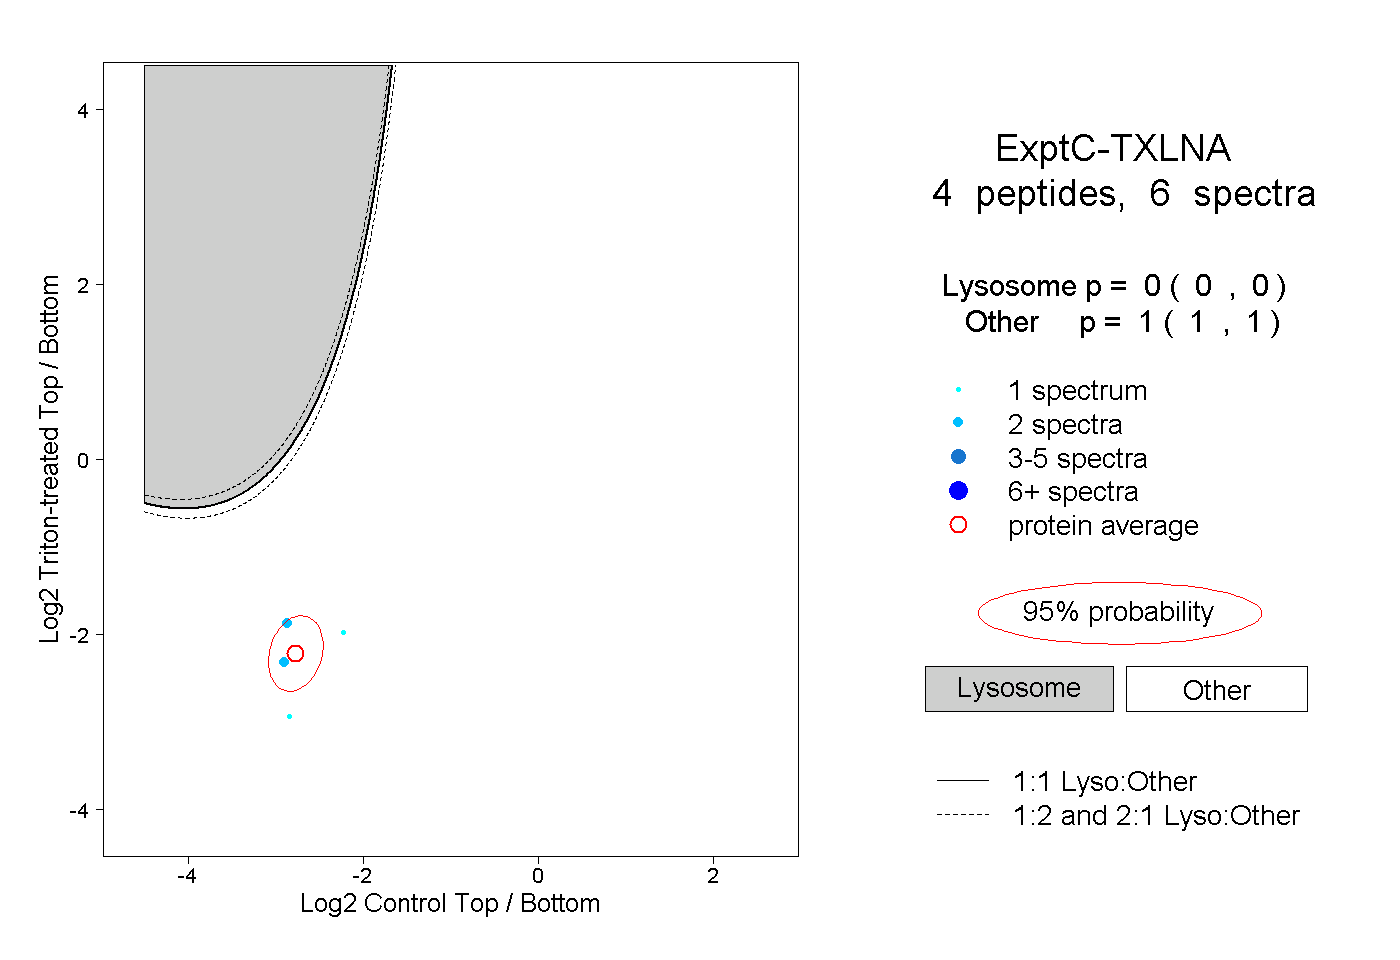 |
0.000 0.000 | 0.000 |
1.000 1.000 | 1.000 |