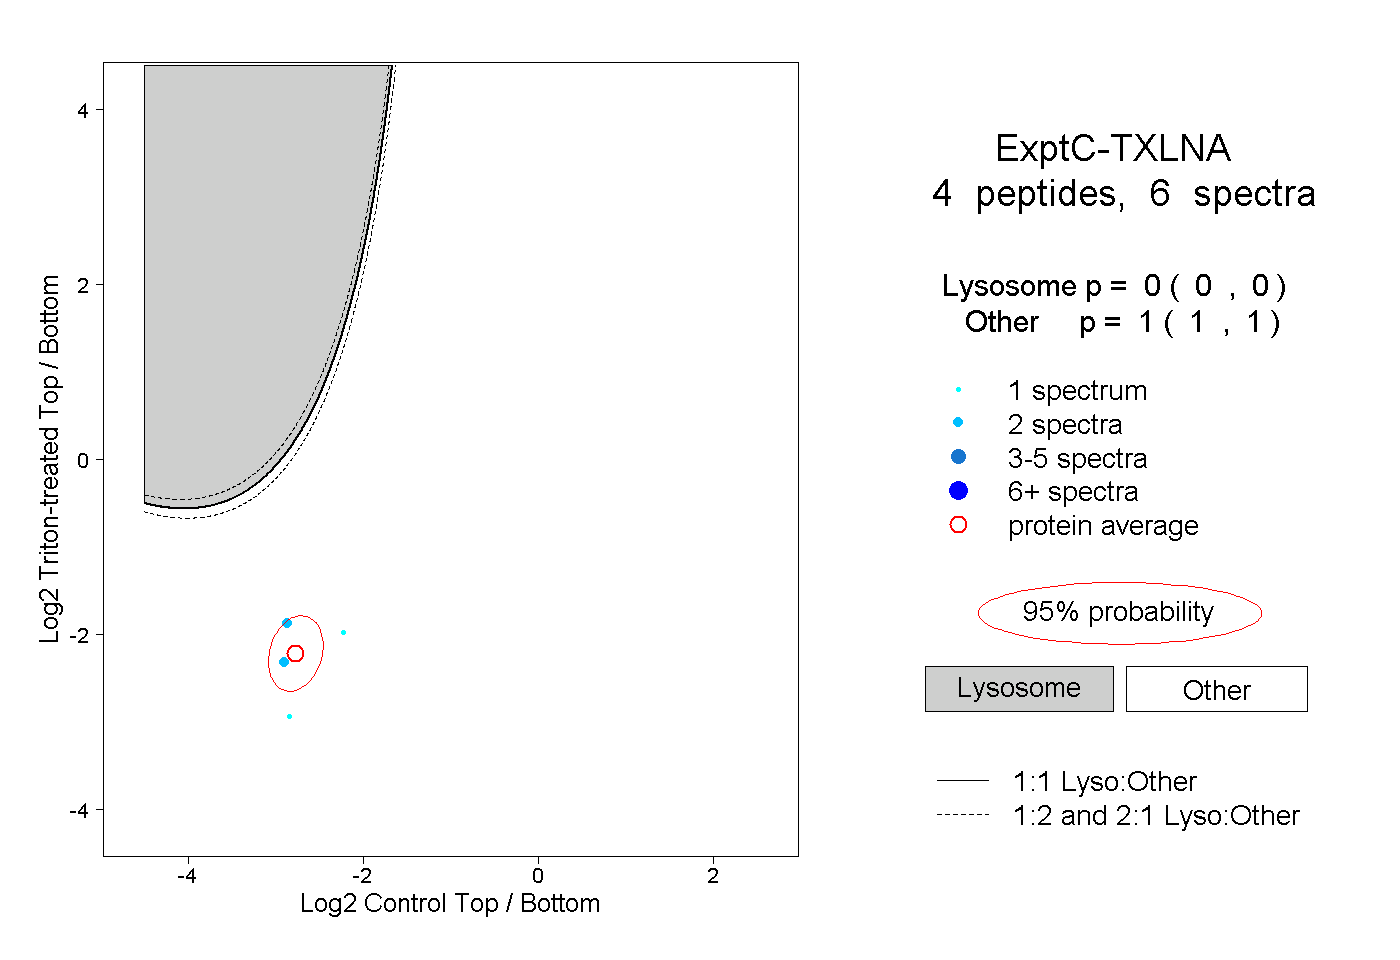
TXLNA
[ENSRNOP00000064617]
Main page
| | | Plot |
Mito |
Lyso |
|
Perox |
ER |
Golgi |
PM |
Cytosol |
Nucleus |
|
| Expt A |
 9
9
peptides |
18
spectra |
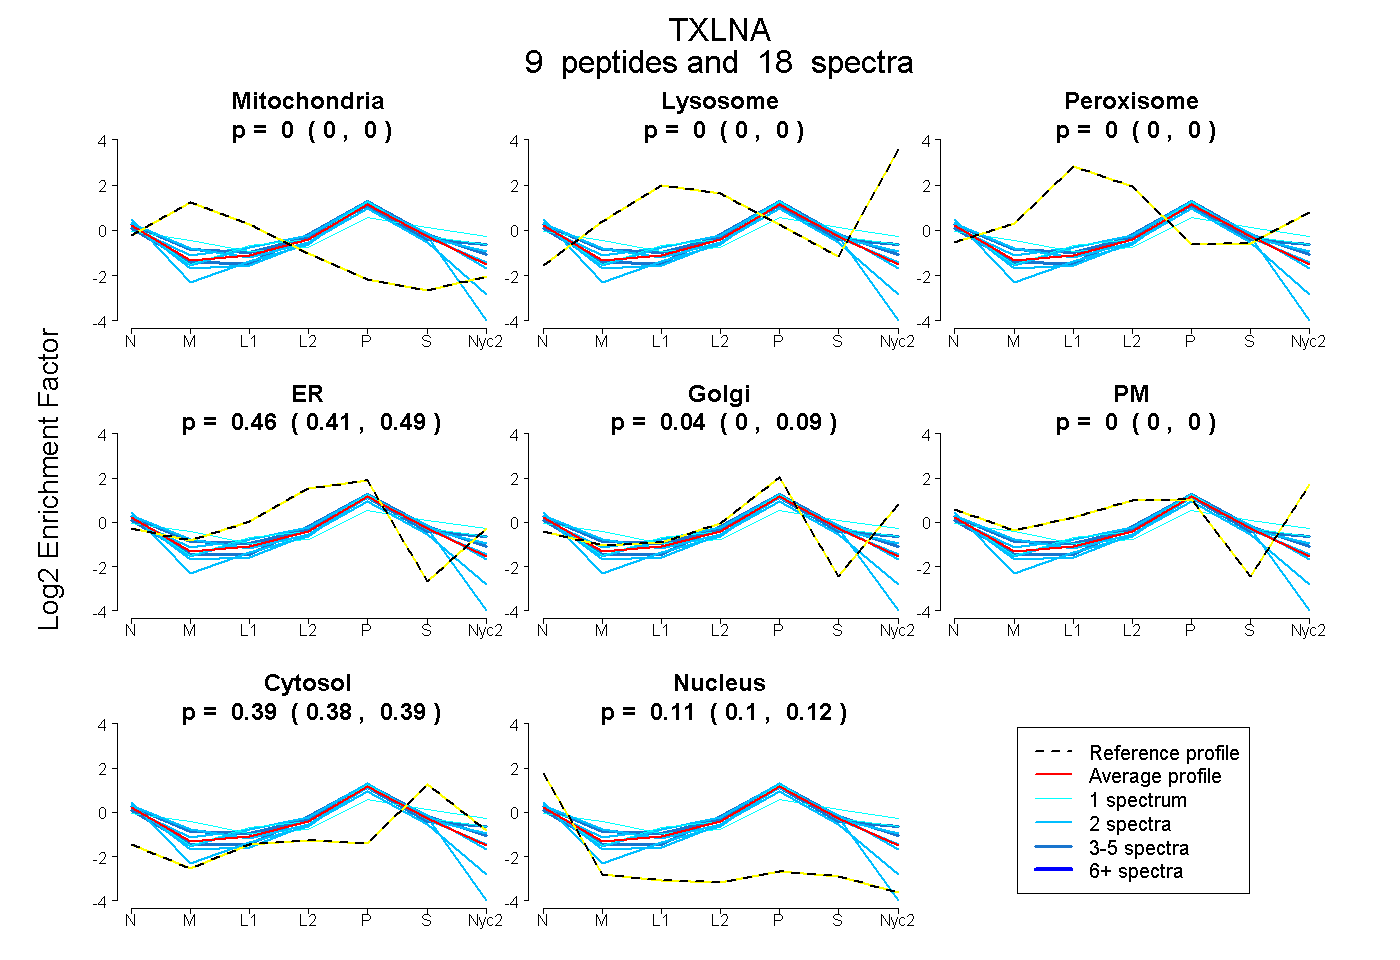 |
0.000
0.000 | 0.000 |
0.000
0.000 | 0.000 |
|
0.000
0.000 | 0.000 |
0.461
0.413 | 0.493 |
0.040
0.000 | 0.090 |
0.000
0.000 | 0.000 |
0.387
0.380 | 0.392 |
0.112
0.098 | 0.124 |
|
| | | Plot |
Mito |
|
Lyso or Perox |
|
ER |
Golgi |
PM |
Cytosol |
Nucleus |
|
| Expt B |
3
peptides |
3
spectra |
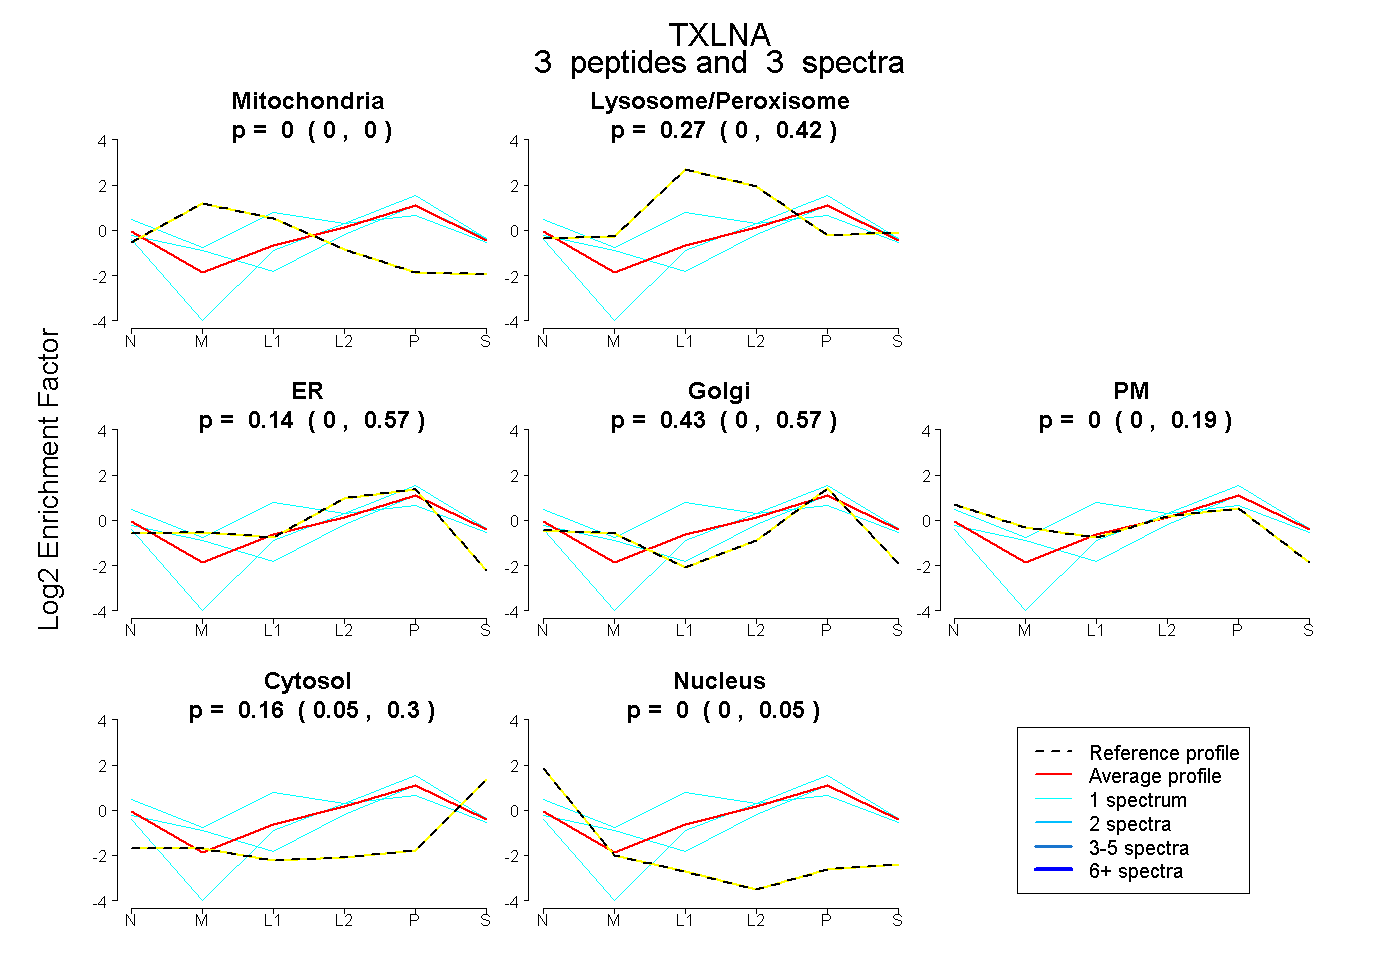 |
0.000
0.000 | 0.000 |
|
0.273
0.000 | 0.422 |
|
0.135
0.000 | 0.569 |
0.435
0.000 | 0.570 |
0.000
0.000 | 0.187 |
0.157
0.049 | 0.298 |
0.000
0.000 | 0.052 |
|
| 1 spectrum, EAVESQR |
0.000 |
|
0.515 |
|
0.000 |
0.234 |
0.190 |
0.000 |
0.061 |
|
| 1 spectrum, EEHLDK |
0.000 |
|
0.020 |
|
0.655 |
0.000 |
0.000 |
0.325 |
0.000 |
|
| 1 spectrum, YAELLEEHR |
0.000 |
|
0.081 |
|
0.130 |
0.523 |
0.062 |
0.204 |
0.000 |
|
| | | Plot |
|
Lyso |
|
|
|
|
|
|
|
Other |
| Expt C |
4
peptides |
6
spectra |
 |
|
0.000
0.000 | 0.000 |
|
|
|
|
|
|
|
1.000
1.000 | 1.000 |