 5
5peptides
spectra
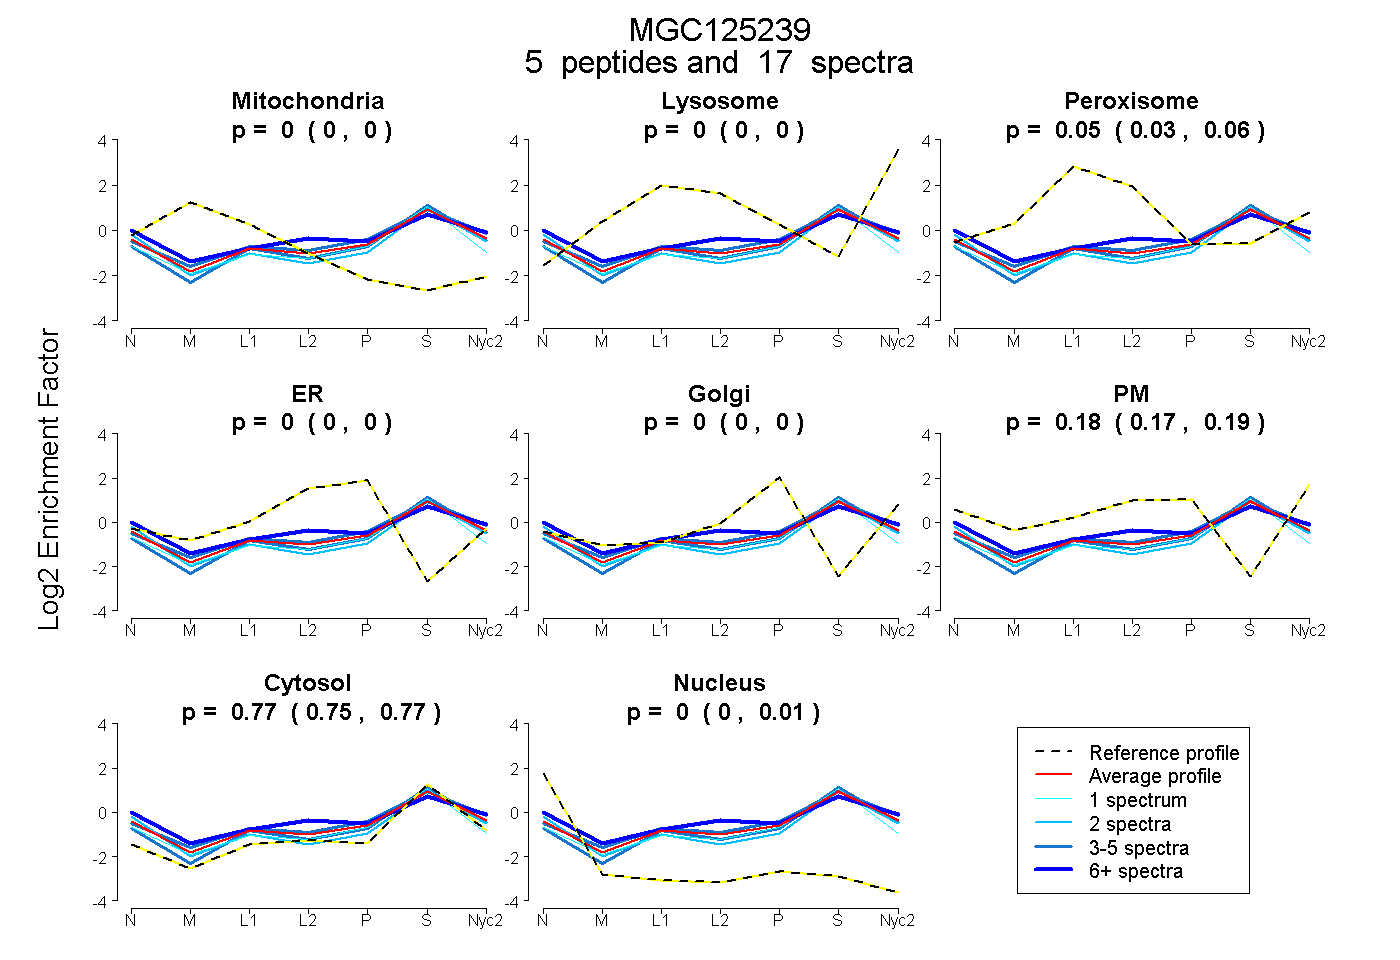
0.000 | 0.000
0.000 | 0.000
0.034 | 0.057
0.000 | 0.000
0.000 | 0.000
0.171 | 0.194
0.752 | 0.775
0.000 | 0.013
4peptides
spectra
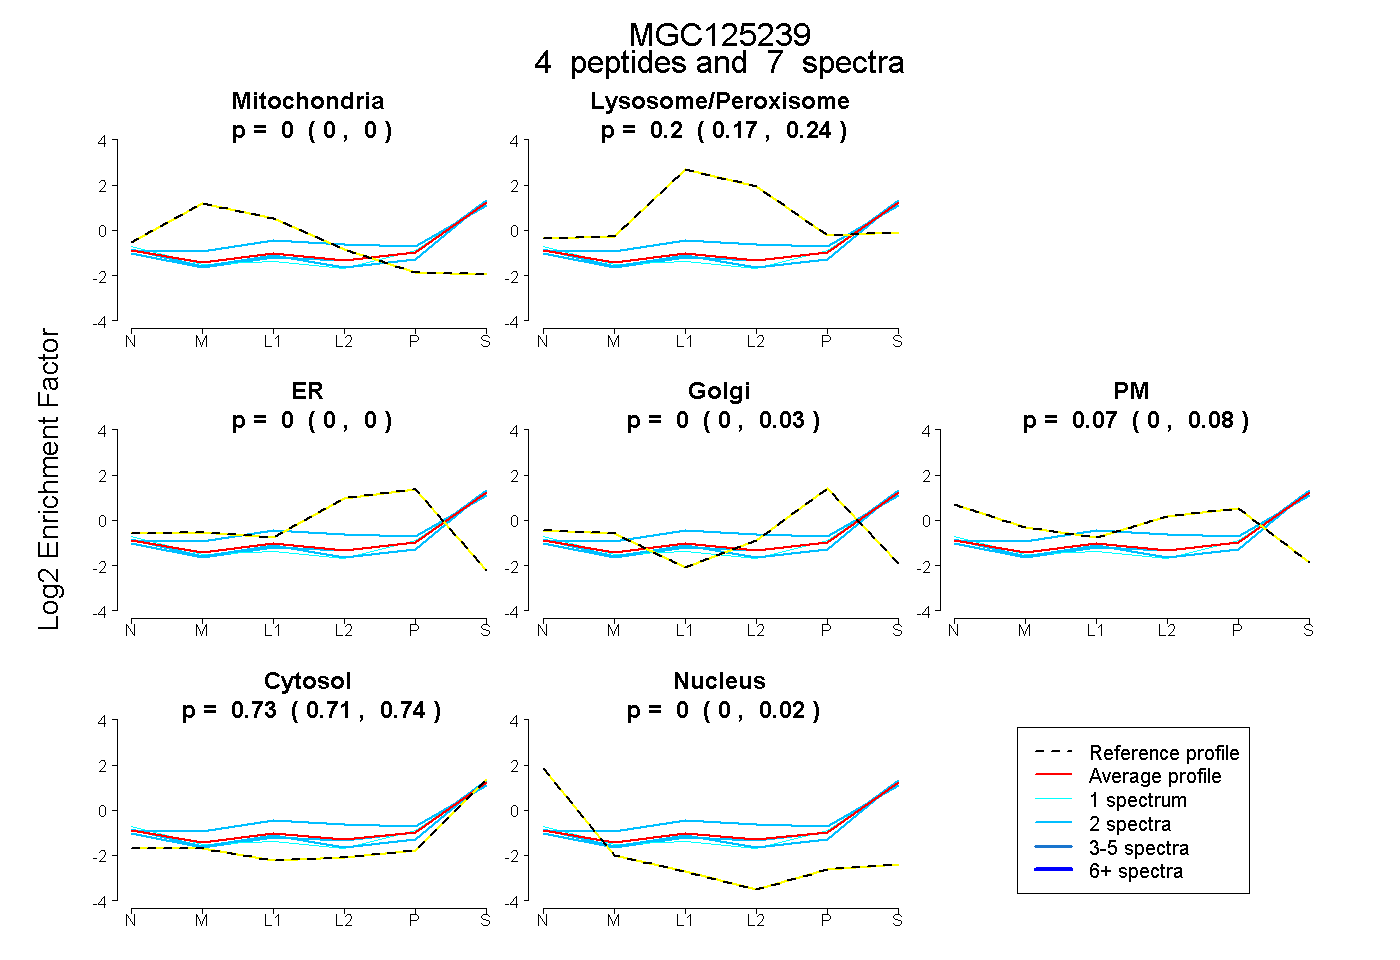
0.000 | 0.000
0.173 | 0.238
0.000 | 0.000
0.000 | 0.029
0.000 | 0.083
0.709 | 0.743
0.000 | 0.023
6peptides
spectra
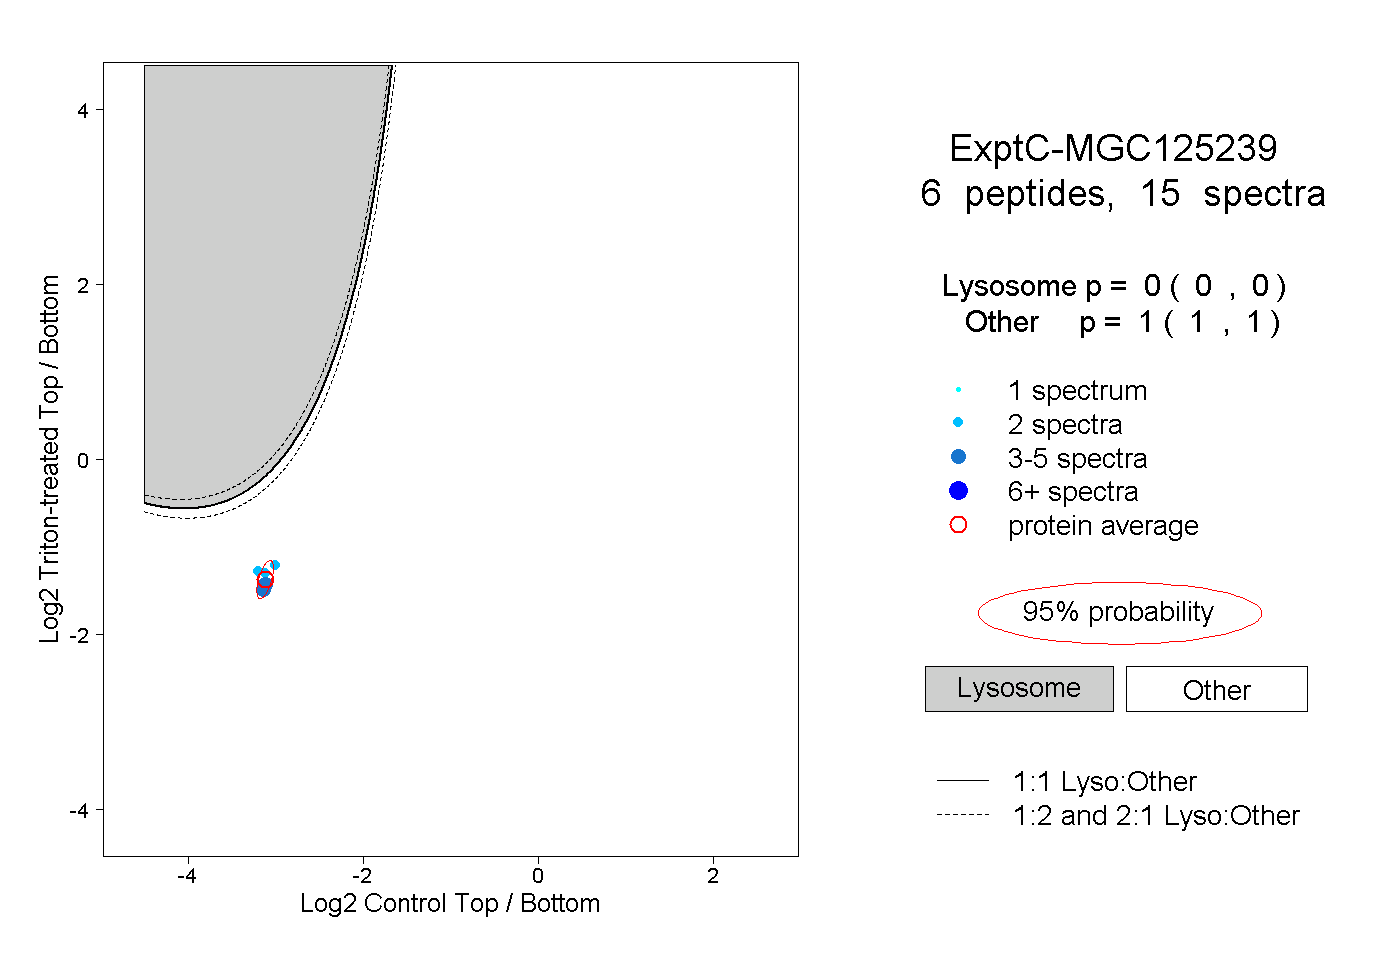
0.000 | 0.000
1.000 | 1.000