 5
5peptides
spectra
0.000 | 0.000
0.000 | 0.000
0.034 | 0.057
0.000 | 0.000
0.000 | 0.000
0.171 | 0.194
0.752 | 0.775
0.000 | 0.013
| Plot | Mito | Lyso | Perox | ER | Golgi | PM | Cytosol | Nucleus | |||||
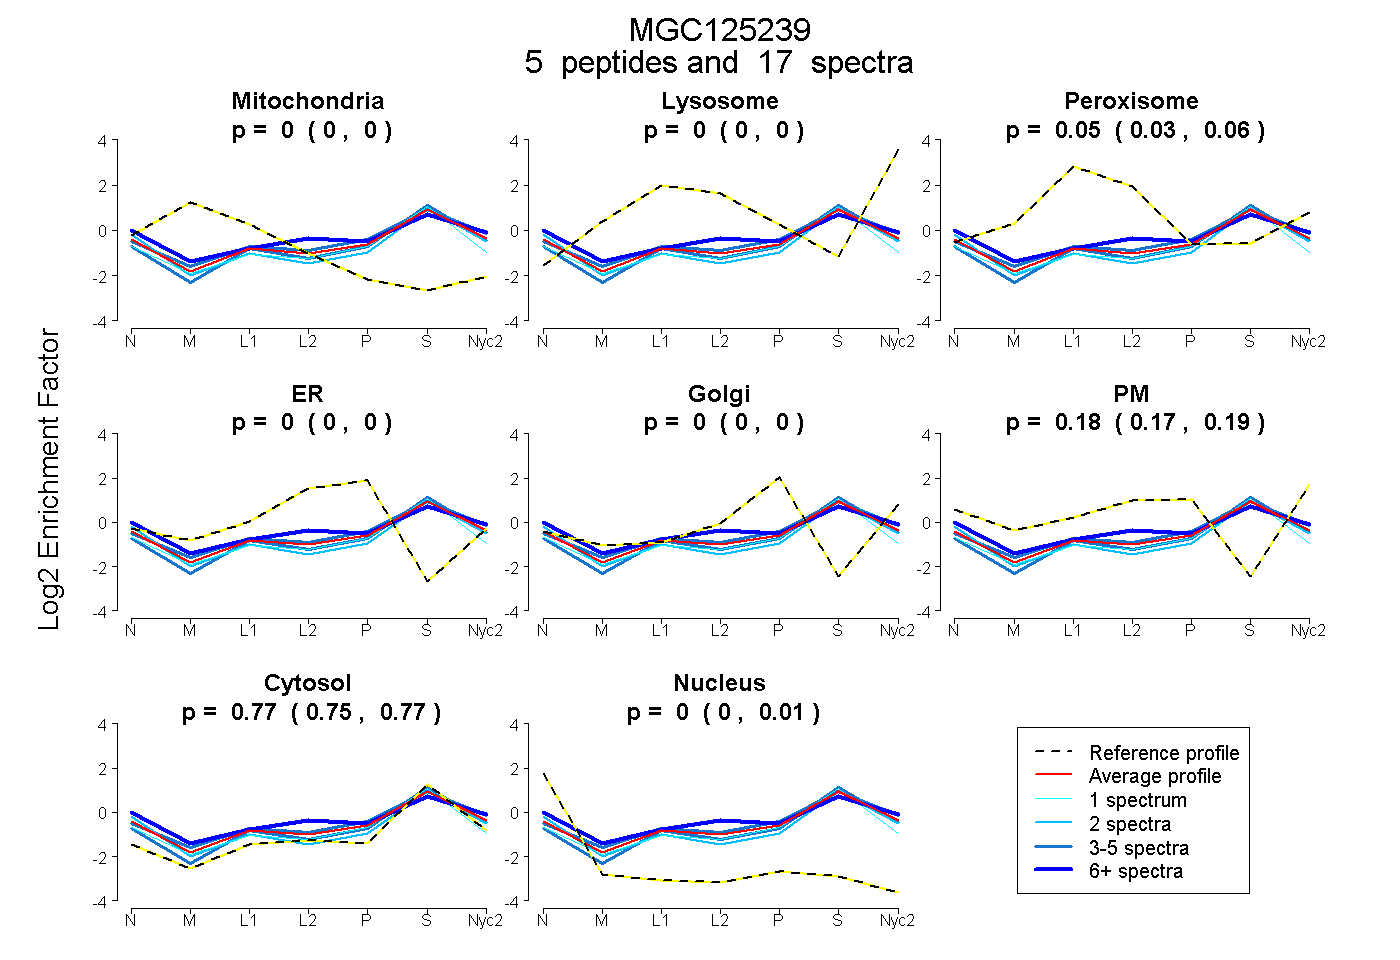
| Expt A |
5 peptides |
17 spectra |
|
0.000 0.000 | 0.000 |
0.000 0.000 | 0.000 |
0.046 0.034 | 0.057 |
0.000 0.000 | 0.000 |
0.000 0.000 | 0.000 |
0.184 0.171 | 0.194 |
0.765 0.752 | 0.775 |
0.005 0.000 | 0.013 |
| 6 spectra, VHAALASLR | 0.000 | 0.000 | 0.085 | 0.000 | 0.000 | 0.270 | 0.641 | 0.005 | ||
| 1 spectrum, HLLLGAIHK | 0.004 | 0.000 | 0.072 | 0.000 | 0.082 | 0.000 | 0.800 | 0.041 | ||
| 3 spectra, EDFSGYDFENR | 0.000 | 0.000 | 0.031 | 0.000 | 0.000 | 0.119 | 0.850 | 0.000 | ||
| 2 spectra, GGWILR | 0.000 | 0.000 | 0.032 | 0.000 | 0.000 | 0.131 | 0.770 | 0.067 | ||
| 5 spectra, DAFDSFER | 0.000 | 0.000 | 0.069 | 0.000 | 0.000 | 0.207 | 0.724 | 0.000 |
| Plot | Mito | Lyso or Perox | ER | Golgi | PM | Cytosol | Nucleus | ||||||
| Expt B |
4 peptides |
7 spectra |
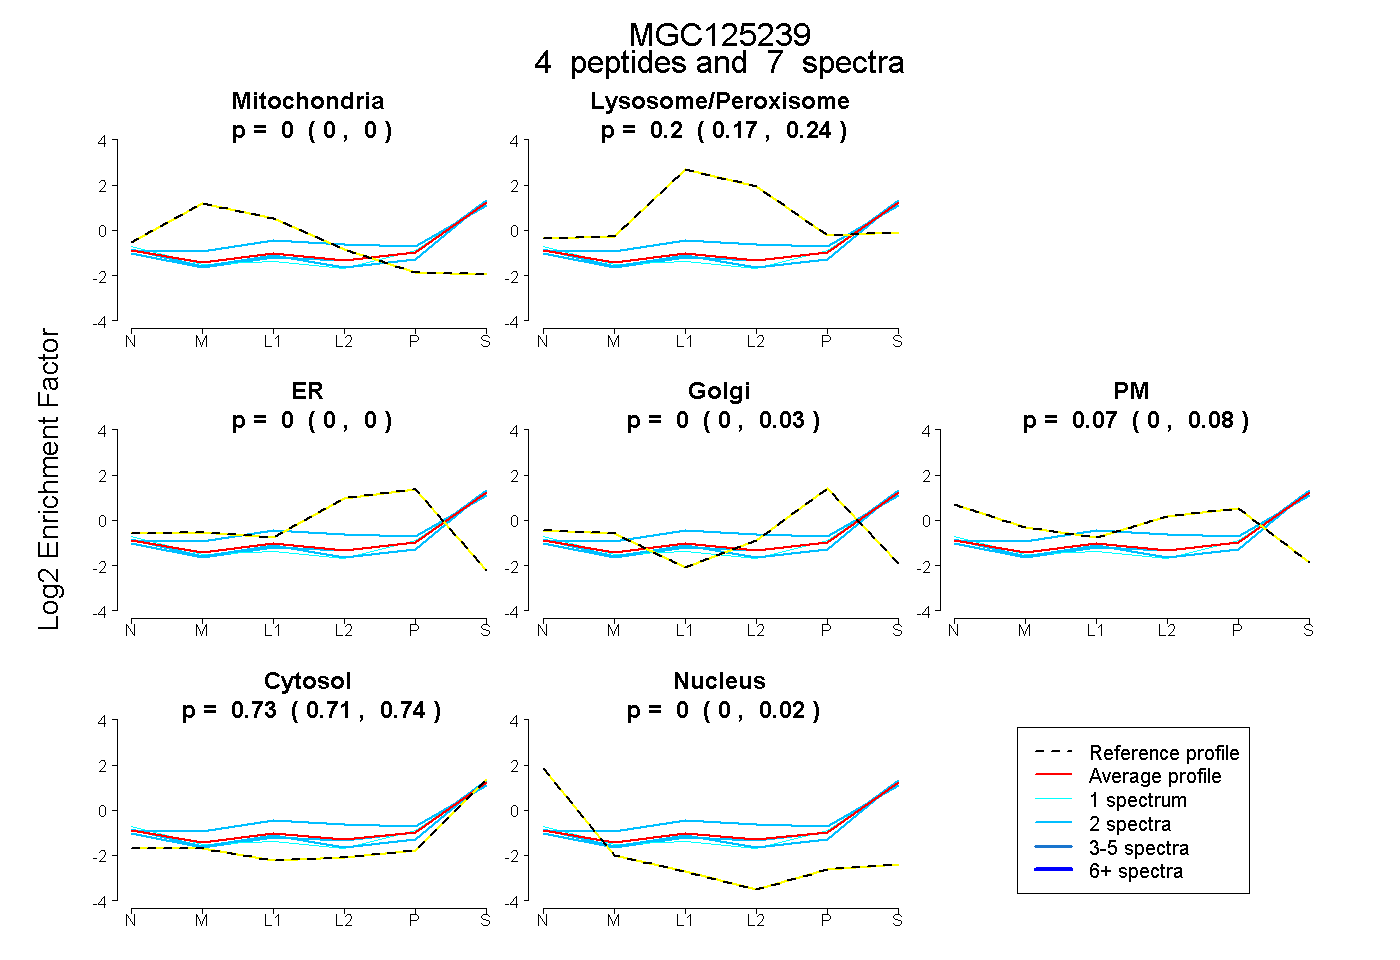 |
0.000 0.000 | 0.000 |
0.203 0.173 | 0.238 |
0.000 0.000 | 0.000 |
0.000 0.000 | 0.029 |
0.066 0.000 | 0.083 |
0.731 0.709 | 0.743 |
0.000 0.000 | 0.023 |
|||
| Plot | Lyso | Other | |||||||||||
| Expt C |
6 peptides |
15 spectra |
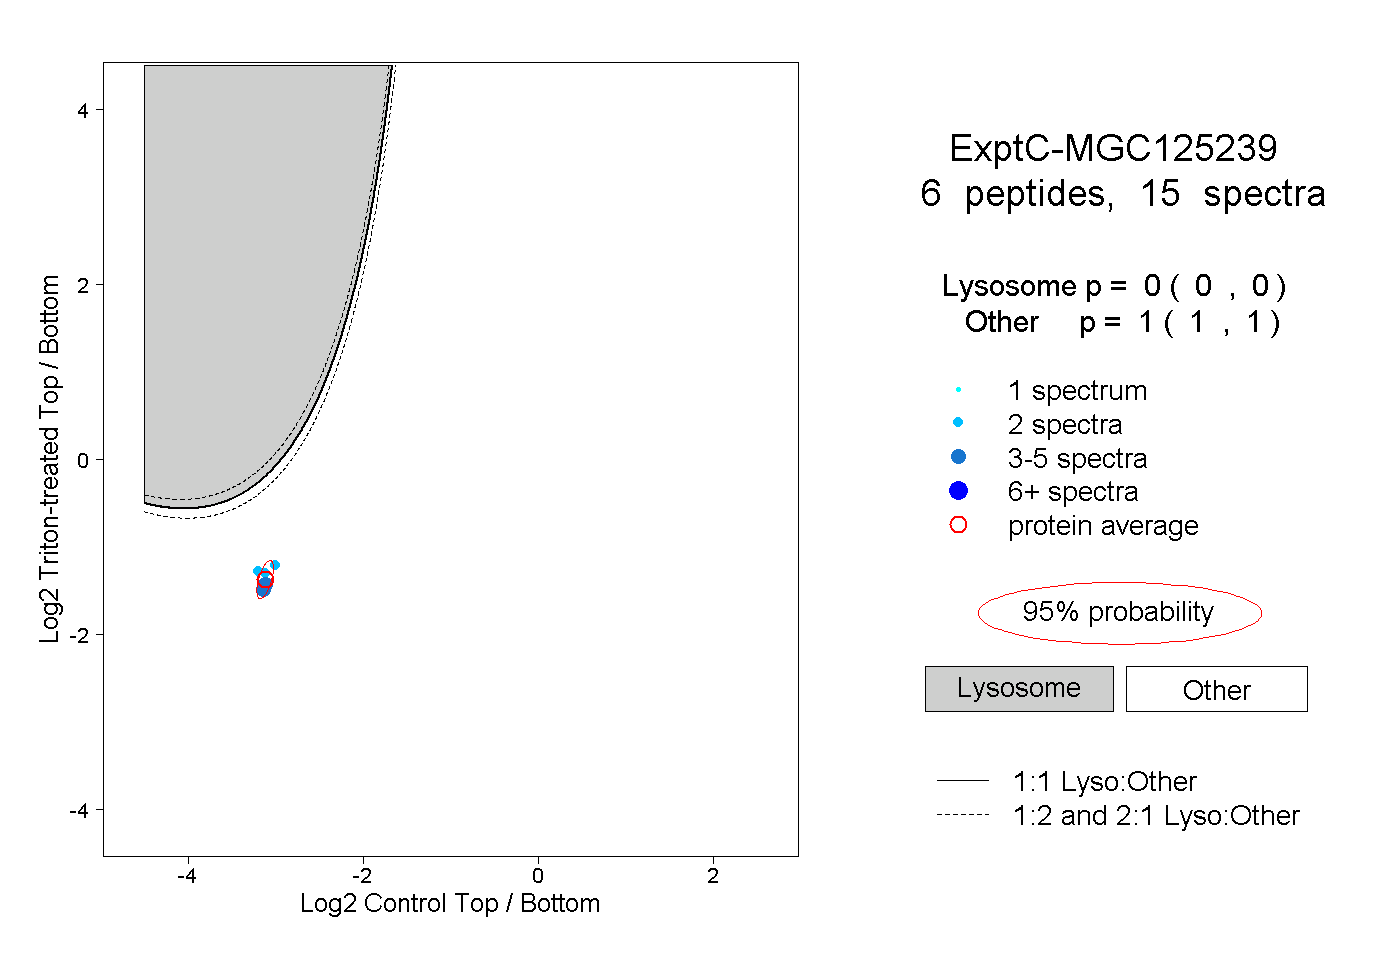 |
0.000 0.000 | 0.000 |
1.000 1.000 | 1.000 |