MGC125239
[ENSRNOP00000064542]
Main page
| | | Plot |
Mito |
Lyso |
|
Perox |
ER |
Golgi |
PM |
Cytosol |
Nucleus |
|
| Expt A |
 5
5
peptides |
17
spectra |
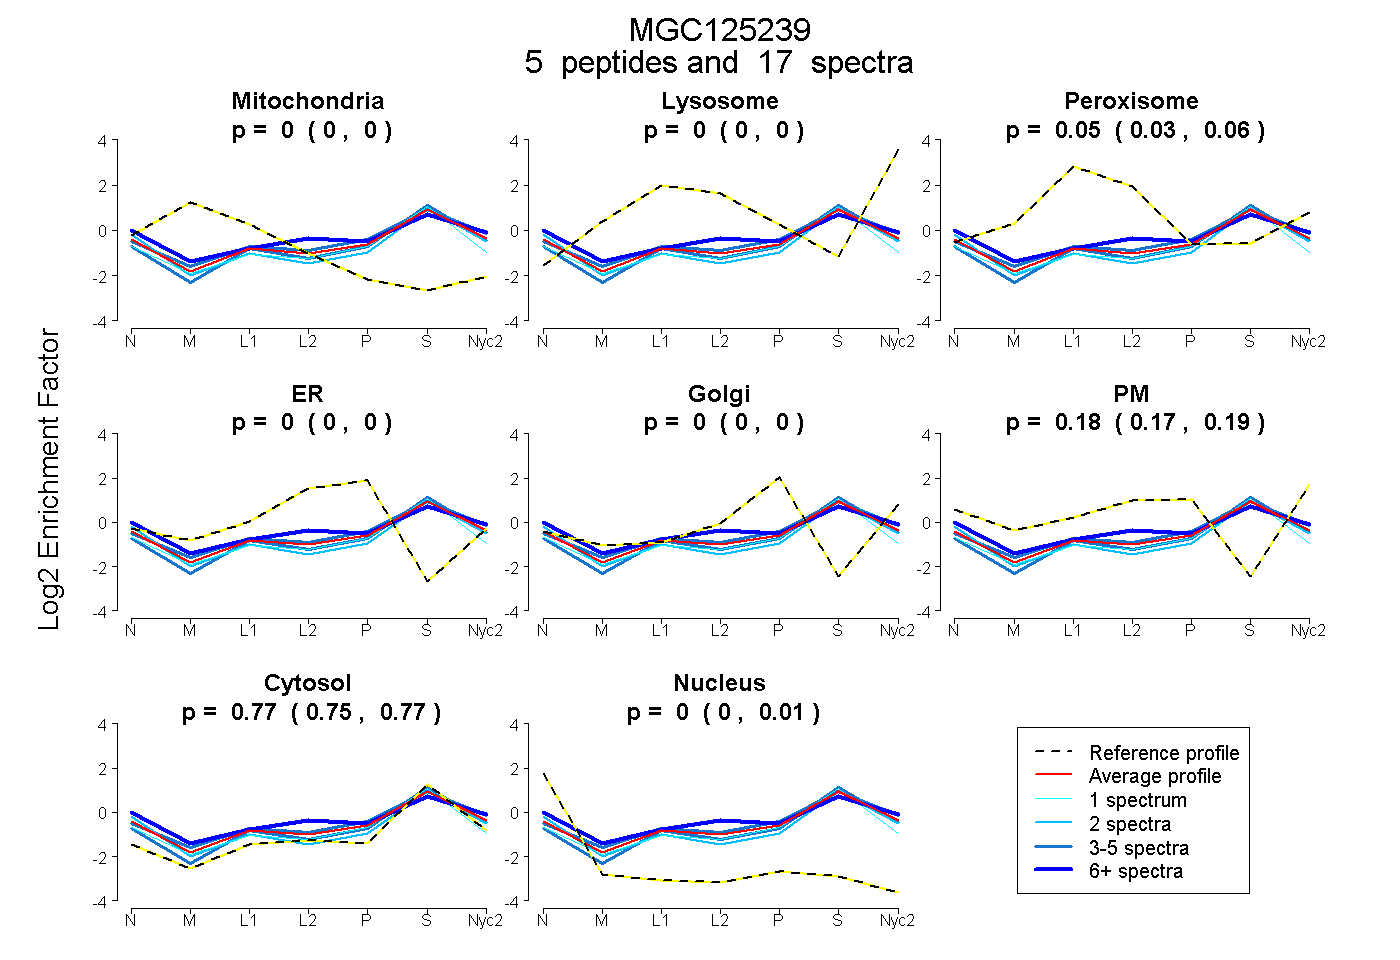 |
0.000
0.000 | 0.000 |
0.000
0.000 | 0.000 |
|
0.046
0.034 | 0.057 |
0.000
0.000 | 0.000 |
0.000
0.000 | 0.000 |
0.184
0.171 | 0.194 |
0.765
0.752 | 0.775 |
0.005
0.000 | 0.013 |
|
| | | Plot |
Mito |
|
Lyso or Perox |
|
ER |
Golgi |
PM |
Cytosol |
Nucleus |
|
| Expt B |
4
peptides |
7
spectra |
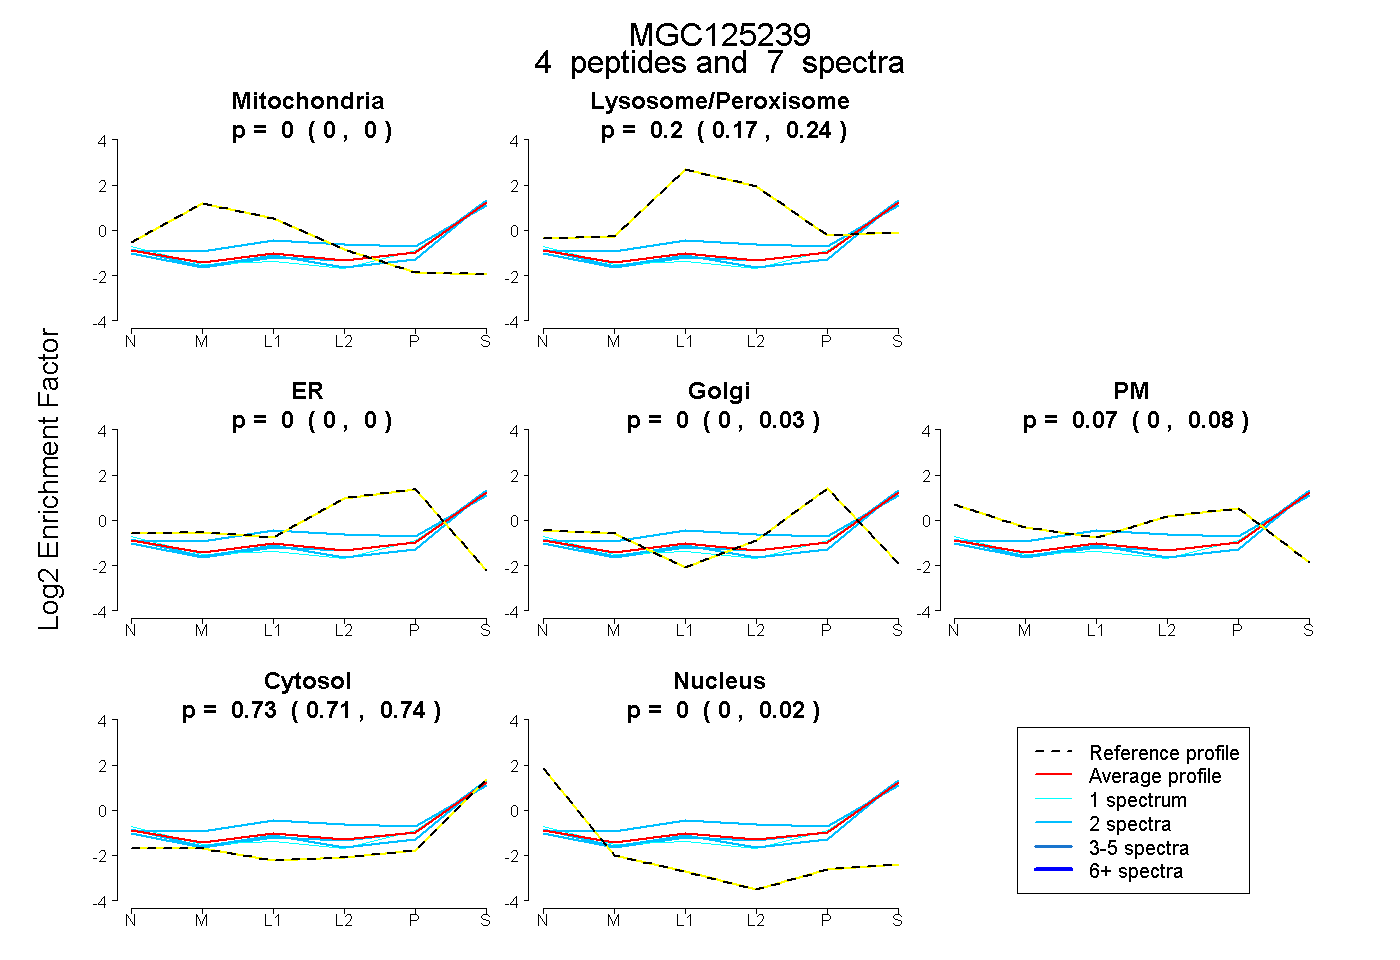 |
0.000
0.000 | 0.000 |
|
0.203
0.173 | 0.238 |
|
0.000
0.000 | 0.000 |
0.000
0.000 | 0.029 |
0.066
0.000 | 0.083 |
0.731
0.709 | 0.743 |
0.000
0.000 | 0.023 |
|
| 1 spectrum, EDFSGYDFENR |
0.000 |
|
0.104 |
|
0.000 |
0.000 |
0.133 |
0.753 |
0.010 |
|
| 2 spectra, VHAALASLR |
0.000 |
|
0.363 |
|
0.000 |
0.054 |
0.000 |
0.583 |
0.000 |
|
| 2 spectra, IINLLGFPGDR |
0.000 |
|
0.190 |
|
0.000 |
0.000 |
0.000 |
0.754 |
0.055 |
|
| 2 spectra, DAFDSFER |
0.000 |
|
0.195 |
|
0.000 |
0.041 |
0.000 |
0.764 |
0.000 |
|
| | | Plot |
|
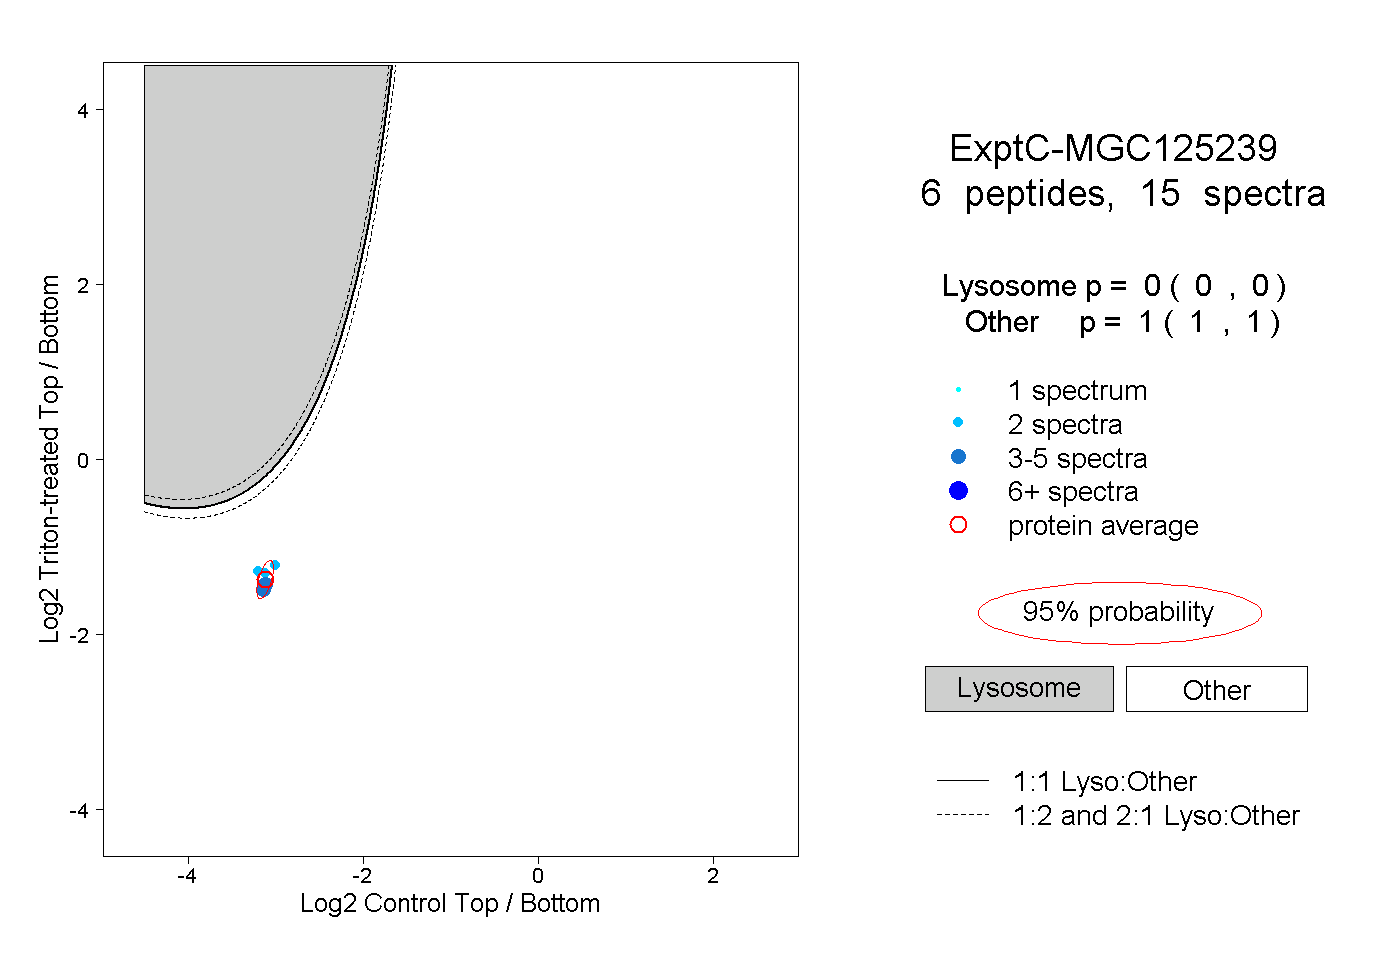
Lyso |
|
|
|
|
|
|
|
Other |
| Expt C |
6
peptides |
15
spectra |
 |
|
0.000
0.000 | 0.000 |
|
|
|
|
|
|
|
1.000
1.000 | 1.000 |